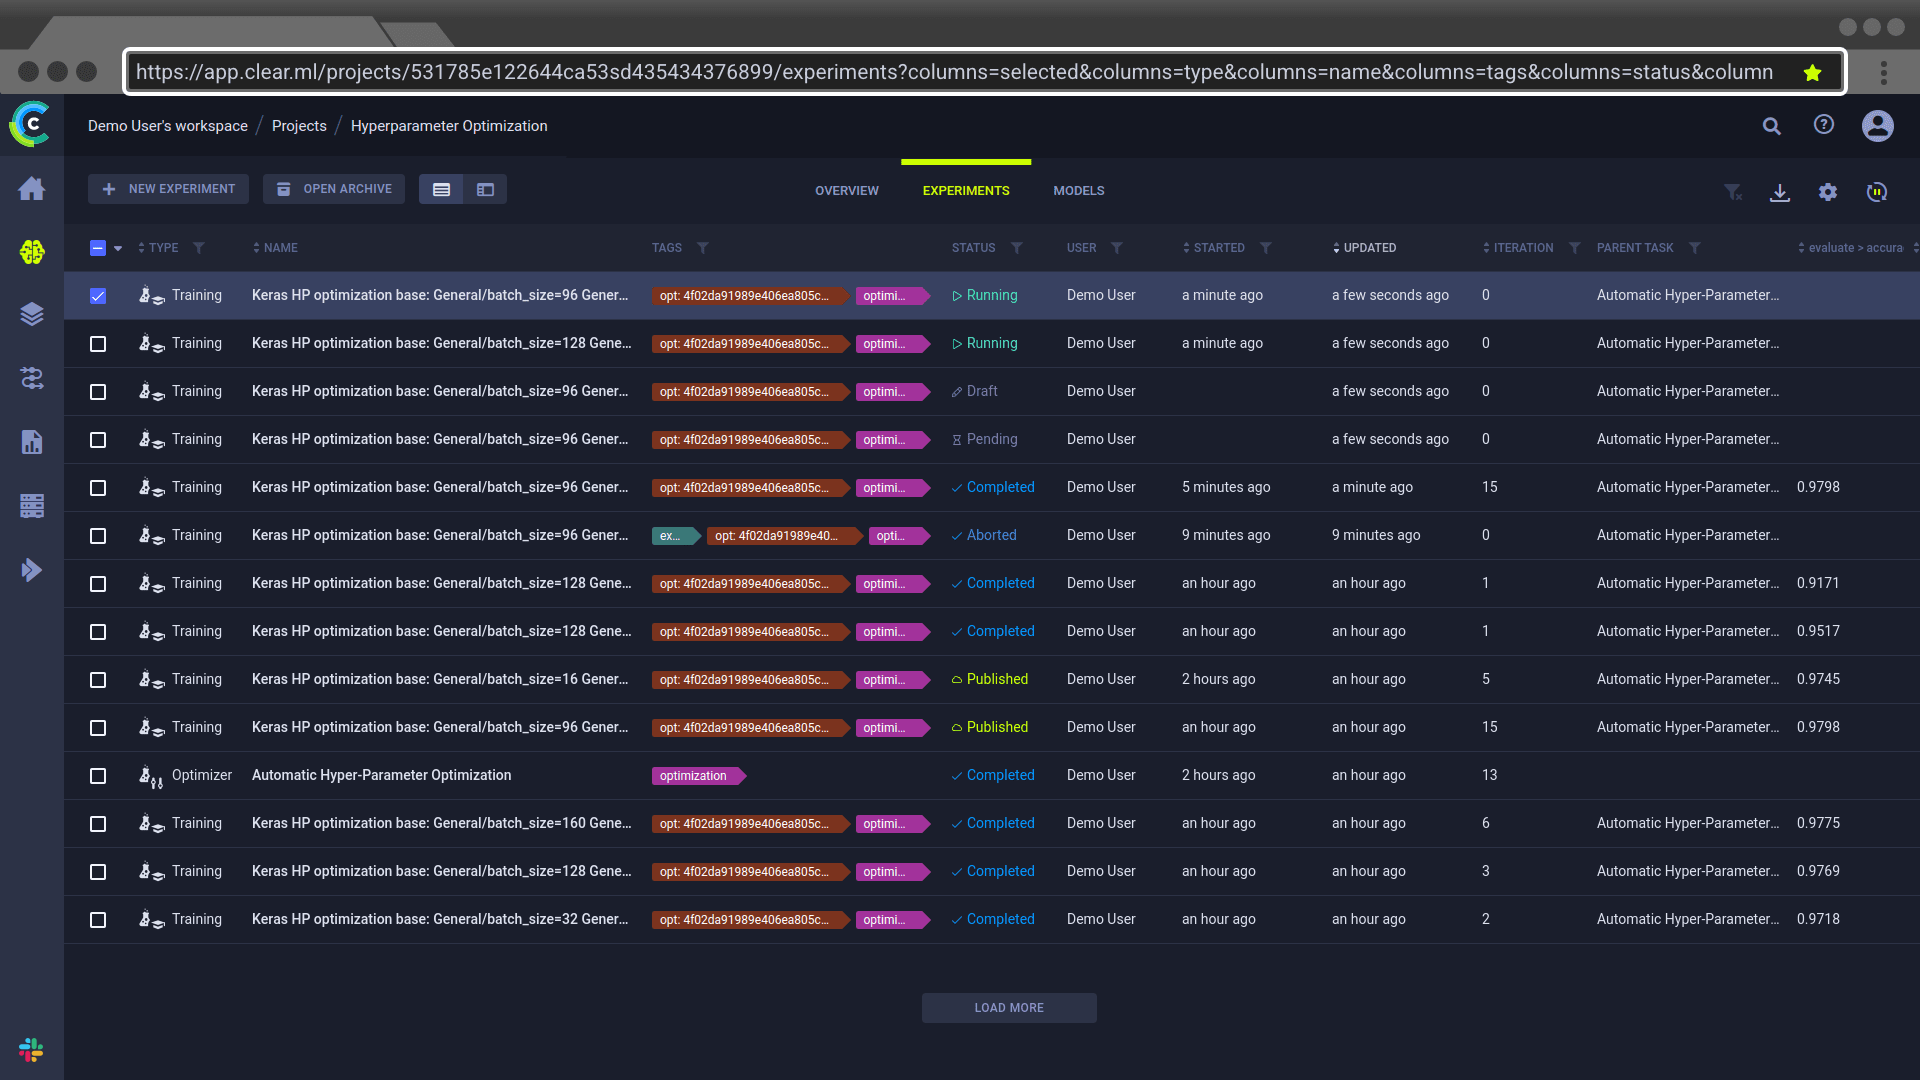
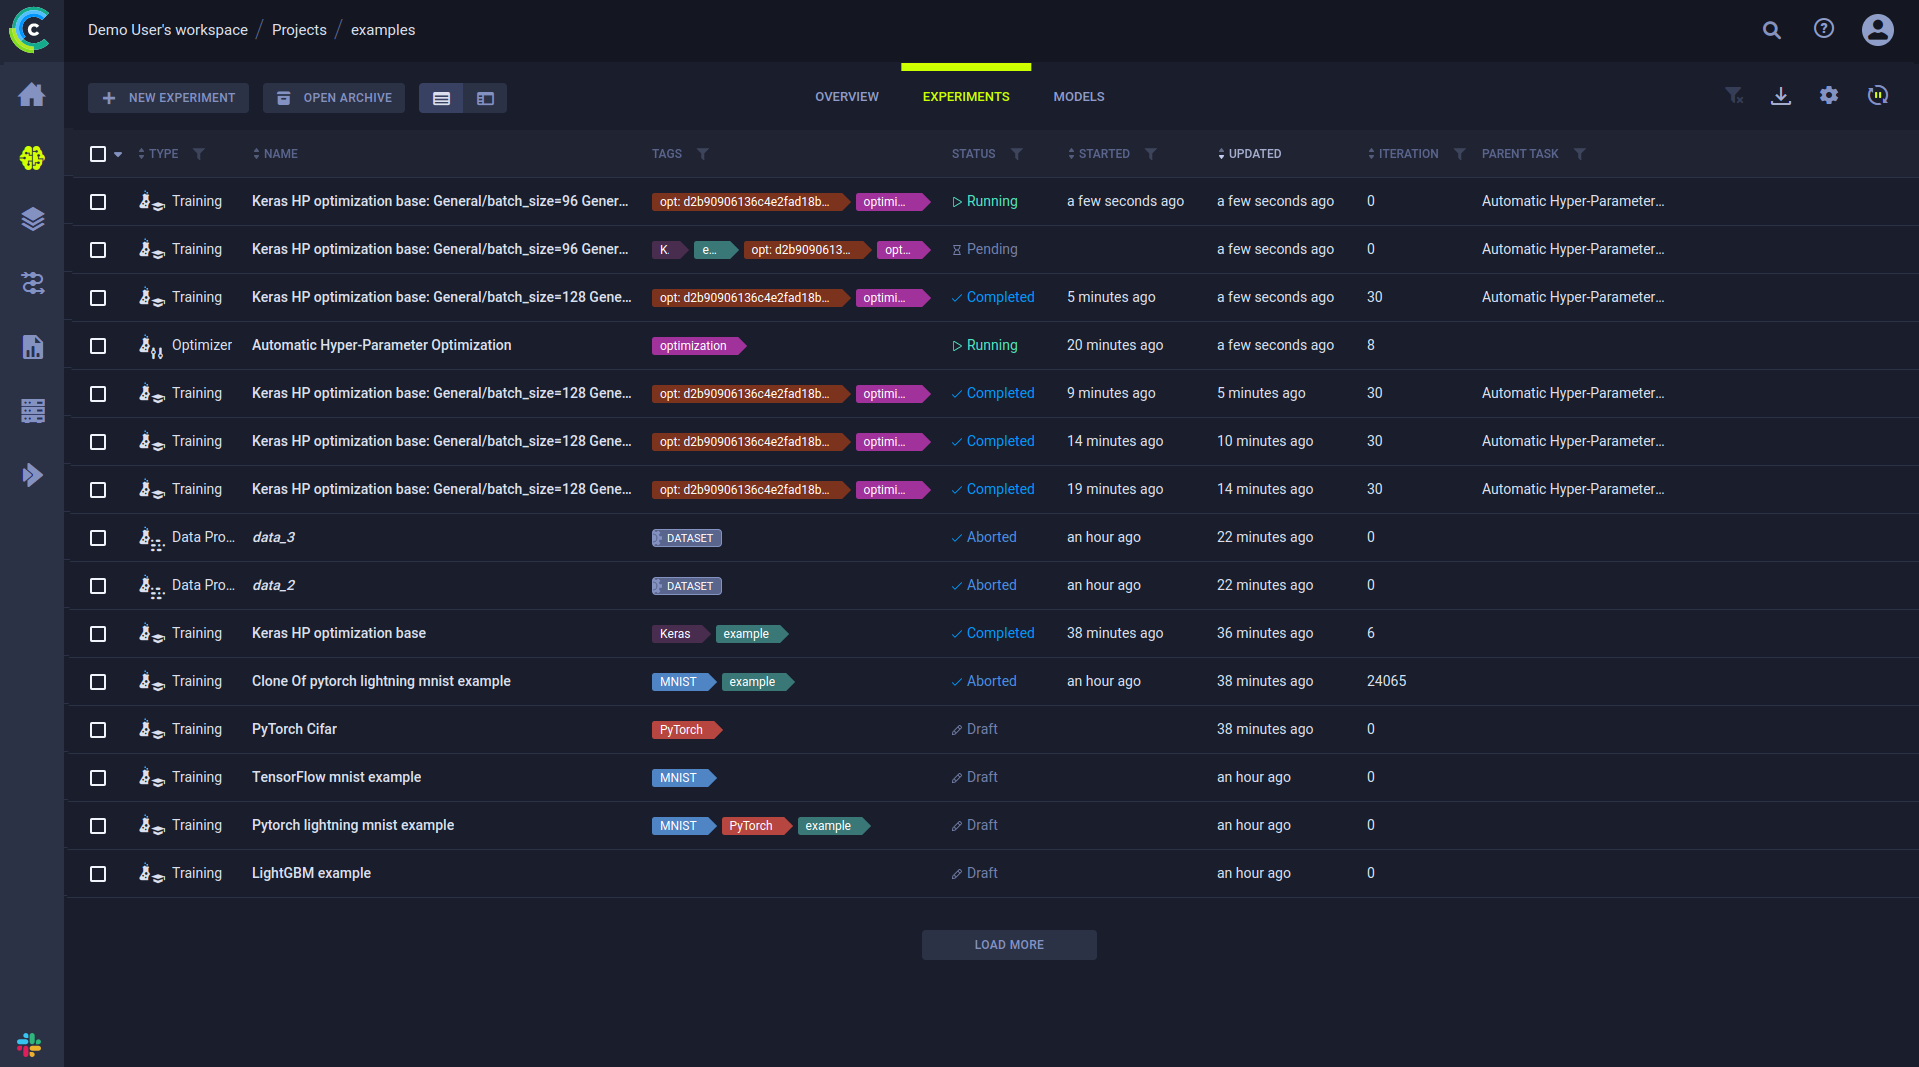
The Experiments Table
The experiments table is a customizable list of experiments associated with a project. From the experiments table, view experiment details, and work with experiments (reset, clone, enqueue, create tracking leaderboards to monitor experimentation, and more). The experiments table's auto-refresh lets users continually monitor experiment progress.
View the experiments in table view ![]() ,
details view
,
details view ![]() , or
comparison view
, or
comparison view ![]() using the buttons on the top left of the page. Use the table view for a comparative view of your experiments according
to columns of interest. Use the details view to access a selected experiment's details, while keeping the experiment list
in view. Details view can also be accessed by double-clicking a specific experiment in the table view to open its details view.
Use the comparison view to compare your experiments' scalar and plot results (for a more in
depth comparison, see Comparing Experiments). When selected, this view presents a comparison
of all selected experiments. If no experiments are selected, all currently visible experiments in the table are compared.
using the buttons on the top left of the page. Use the table view for a comparative view of your experiments according
to columns of interest. Use the details view to access a selected experiment's details, while keeping the experiment list
in view. Details view can also be accessed by double-clicking a specific experiment in the table view to open its details view.
Use the comparison view to compare your experiments' scalar and plot results (for a more in
depth comparison, see Comparing Experiments). When selected, this view presents a comparison
of all selected experiments. If no experiments are selected, all currently visible experiments in the table are compared.
You can archive experiments so the experiments table doesn't get too cluttered. Click OPEN ARCHIVE on the top of the table to open the archive and view all archived experiments. From the archive, you can restore experiments to remove them from the archive. You can also permanently delete experiments.
You can download the experiments table as a CSV file by clicking ![]() and choosing one of these options:
and choosing one of these options:
- Download onscreen items - Download the values for experiments currently visible on screen
- Download all items - Download the values for all experiments in this project that match the current active filters
The downloaded data consists of the currently displayed table columns.
Experiments Table Columns
The experiments table default and customizable columns are described in the following table.
| Column | Description | Type |
|---|---|---|
| TYPE | Type of experiment. ClearML supports multiple task types for experimentation, and a variety of workflows and use cases. | Default |
| NAME | Experiment name. | Default |
| TAGS | Descriptive, user-defined, color-coded tags assigned to experiments. Use tags to classify experiments, and filter the list. See tagging experiments. | Default |
| STATUS | Experiment state (status). See a list of the task states and state transitions. If you programmatically set task progress values, you will also see a progress indicator for Running, Failed, and Aborted tasks. See here. | Default |
| PROJECT | Name of experiment's project. | Default |
| USER | User who created or cloned the experiment. | Default (hidden) |
| STARTED | Elapsed time since the experiment started. To view the date and time of start, hover over the elapsed time. | Default |
| UPDATED | Elapsed time since the last update to the experiment. To view the date and time of update, hover over the elapsed time. | Default |
| ITERATION | Last or most recent iteration of the experiment. | Default |
| DESCRIPTION | A description of the experiment. For cloned experiments, the description indicates it was auto generated with a timestamp. | Default (hidden) |
| RUN TIME | The current / total running time of the experiment. | Default (hidden) |
| Metrics | Add metrics column (last, minimum, and/or maximum values). The metrics depend upon the experiments in the table. See adding metrics. | Customizable |
| Hyperparameters | Add hyperparameters. The hyperparameters depend upon the experiments in the table. See adding hyperparameters. | Customizable |
Customizing the Experiments Table
Customize the table using any of the following:
- Dynamic column order - Drag a column title to a different position.
- Resize columns - Drag the column separator to change the width of that column. Double-click the column separator for automatic fit.
- Changing table columns
- Show / hide columns - Click
 > mark or clear the checkboxes of columns to show or hide.
 - Add custom columns - Click + METRICS or + HYPERPARAMETERS to add metric / hyperparameter columns to the main column list. Added columns are by default displayed in the table. You can remove the custom columns from the main column list or the column addition windows.
- Show / hide columns - Click
- Filter columns
- Sort columns - According to metrics and hyperparameters, type of experiment, experiment name, start and last update elapsed time, and last iteration.
Use experiments table customization for various use cases, including:
- Creating a leaderboard that will update in real time with experiment performance, which can be shared and stored.
- Sorting models by metrics - Models are associated with the experiments that created them. For each metric, use the last value, the minimal value, and/or the maximal value.
- Tracking hyperparameters - Track hyperparameters by adding them as columns, and applying filters and sorting.
Changes are persistent (cached in the browser), and represented in the URL so customized settings can be saved in a browser bookmark and shared with other ClearML users to collaborate.
The following experiments-table customizations are saved on a per-project basis:
- Columns order
- Column width
- Active sort order
- Active filters
- Custom columns
If a project has subprojects, the experiments can be viewed by their subproject groupings or together with all the experiments in the project. The customizations of these two views are saved separately.
Adding Metrics and/or Hyperparameters
Add metrics and/or hyperparameters columns to the experiments table. The metrics and hyperparameters depend upon the experiments in the table.
To Add Metrics:
- Click > + METRICS > Expand a metric > Select the LAST (value),
MIN (minimal value), and/or MAX (maximal value) checkboxes.
To Add Hyperparameters:
- Click > + HYPERPARAMETERS > Expand a section > Select the
hyperparameter checkboxes.
By default, the experiments table displays rounded up float values. Hover over a float to view its precise value in the
tooltip that appears. To view all precise values in a column, hover over a float and click ![]() .
.
Filtering Columns
Filters can be applied by clicking ![]() on a column, and the relevant filter appears.
on a column, and the relevant filter appears.
There are a few types of filters:
- Value set - Choose which values to include from a list of all values in the column
- Numerical ranges - Insert minimum and/or maximum value
- Date ranges - Insert starting and/or ending date and time
- Tags - Choose which tags to filter by from a list of all tags used in the column.
- Filter by multiple tag values using the ANY or ALL options, which correspond to the logical "AND" and "OR" respectively. These options appear on the top of the tag list.
- Filter by the absence of a tag (logical "NOT") by clicking its checkbox twice. An
Xwill appear in the tag's checkbox.
Once a filter is applied to a column, its filter icon will appear with a highlighted dot on its top right (![]() ).
).
To clear all active filters, click ![]() in the top right corner of the table.
in the top right corner of the table.
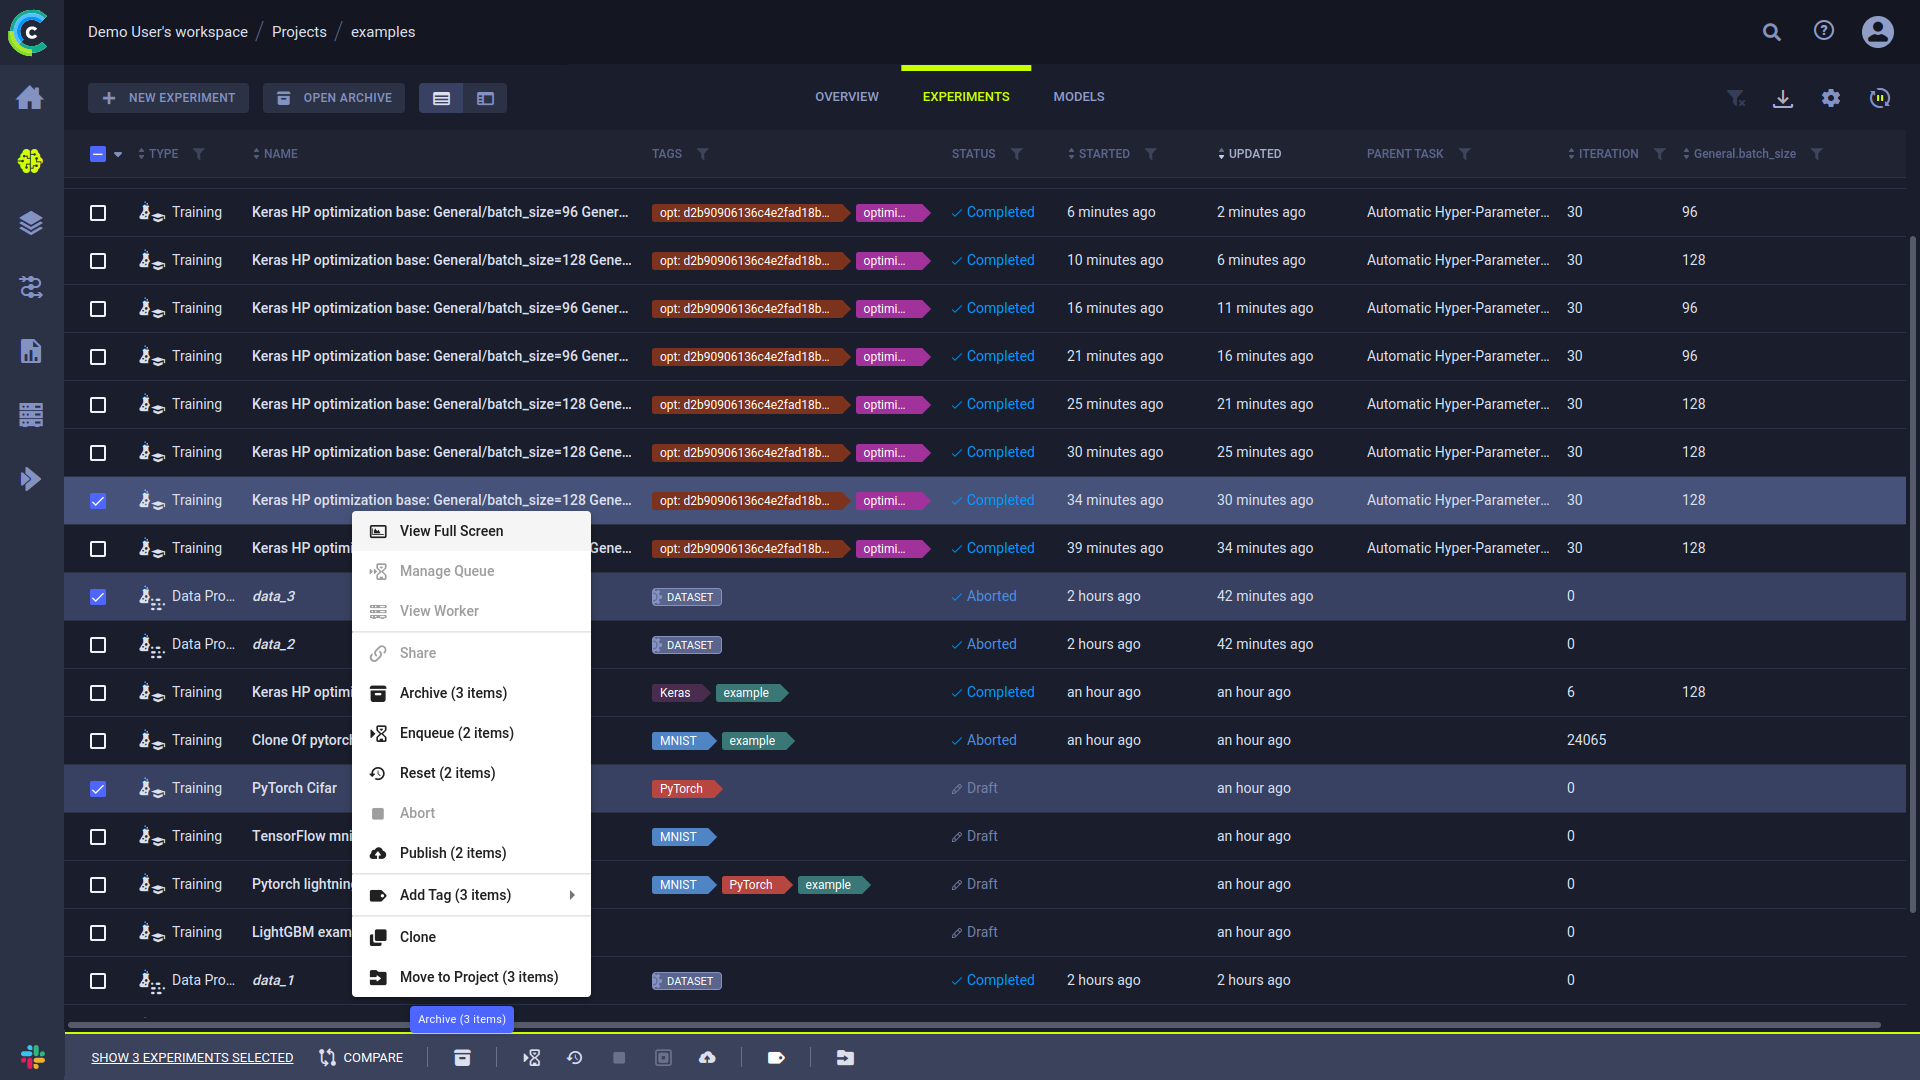
Experiment Actions
The following table describes the actions that can be done from the experiments table, including the states that allow each operation.
Access these actions in any of the following ways:
- In the experiments table, right-click an experiment or hover over an experiment and click
 to open the context menu
 - In an experiment info panel, click the menu button

- Through the batch action bar: available at screen bottom when multiple experiments are selected
| Action | Description | States Valid for the Action | State Transition |
|---|---|---|---|
| Details | Open the experiment's info panel (keeps the experiments list in view). Can also be accessed by double-clicking an experiment in the experiments table. | Any state | None |
| View Full Screen | View experiment details in full screen. | Any state | None |
| Manage Queue | If an experiment is Pending in a queue, view the utilization of that queue, manage that queue (remove experiments and change the order of experiments), and view information about the worker(s) listening to the queue. See the Workers and Queues page. | Enqueued | None |
| View Worker | If an experiment is Running, view resource utilization, worker details, and queues to which a worker is listening. | Running | None |
| Share | For ClearML Hosted Service users only, share an experiment and its model with a ClearML Hosted Service user in another workspace. | Any state | None |
| Archive | Move experiment to the project's archive. If it is shared (ClearML Hosted Service only), the experiment becomes private. | Any state | Pending to Draft |
| Restore | Action available in the archive. Restore an experiment to the active experiments table. | Any State | None |
| Delete | Action available in the archive. Delete an experiment, which will also remove all their logs, results, artifacts and debug samples. | Any State | N/A |
| Enqueue | Add an experiment to a queue for a worker or workers (listening to the queue) to execute. | Draft | Pending |
| Dequeue | Remove an experiment from a queue. | Pending | Draft |
| Reset | Delete the log and output from a previous run of an experiment (for example, before rerunning it). | Completed, Aborted, or Failed | Draft |
| Abort | Manually terminate a Running experiment. | Running | Aborted |
| Abort All Children | Manually terminate all Running experiments which have this task as a parent | Running or Aborted | None for parent experiment, Aborted for child experiments |
| Publish | Publish an experiment to prevent changes to its tracking data, inputs, and outputs. Published experiments and their models are read-only. Published experiments cannot be enqueued, but they can be cloned, and their clones can be edited, tuned, and enqueued. | Completed, Aborted, or Failed. | Published |
| Add Tag | Tag experiments with color-coded labels to assist you in organizing your work. See tagging experiments. | Any state | None |
| Clone | Make an exact, editable copy of an experiment (for example, to reproduce an experiment, but keep the original). | Draft | Newly Cloned Experiment is Draft |
| Move to Project | Move an experiment to another project. | Any state | None |
| Compare | Compare selected experiments (see Comparing Experiments) | Any state | None |
| Custom action | The ClearML Enterprise Server provides a mechanism to define your own custom actions, which will appear in the context menu. See Custom UI Context Menu Actions. | Any State | None |
Most of the actions mentioned in the chart above can be performed on multiple experiments at once. Select multiple experiments, then use either the context menu, or the batch action bar that appears at the bottom of the page, to perform operations on the selected experiments. Actions can be performed only on the experiments that match the action criteria (for example, only Running experiments can be aborted). The context menu shows the number of experiments that can be affected by each action. The same information can be found in the batch action bar, in a tooltip that appears when hovering over an action icon.
Selecting Multiple Experiments
Select multiple experiments by clicking the checkbox on the left of each relevant experiment. Clear any existing selection by clicking the checkbox in the top left corner of the table.
Click the checkbox in the top left corner of the table to select all items currently visible.
An extended bulk selection tool is available through the down arrow next to the checkbox in the top left corner, enabling selecting items beyond the items currently on-screen:
- All - Select all experiments in the project
- None - Clear selection
- Filtered - Select all experiments in the project that match the current active filters in the project
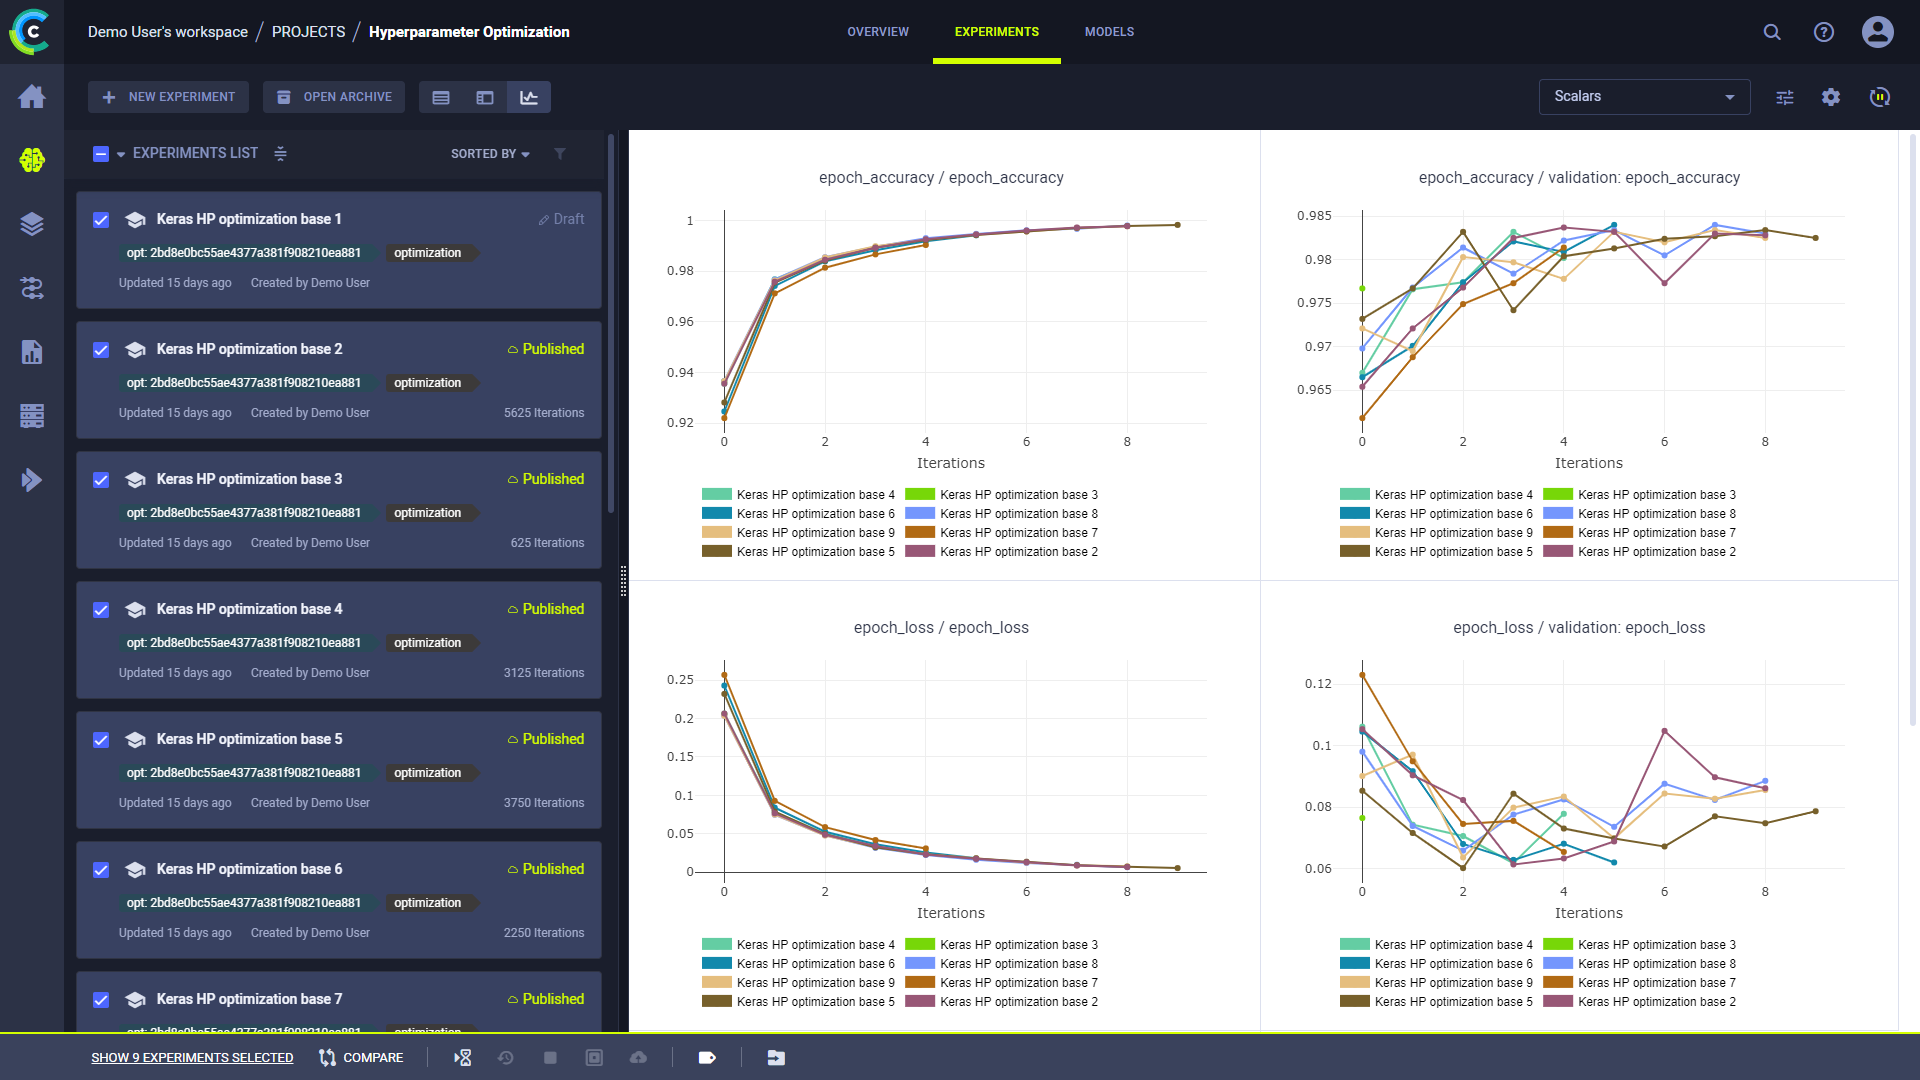
Comparing Experiments
The comparison view compares experiment scalar and plot results (for a more in depth comparison, see Comparing Experiments). When selected, the view presents a comparison of all selected experiments. If no experiments are selected, all currently visible experiments in the table are displayed in the comparison.
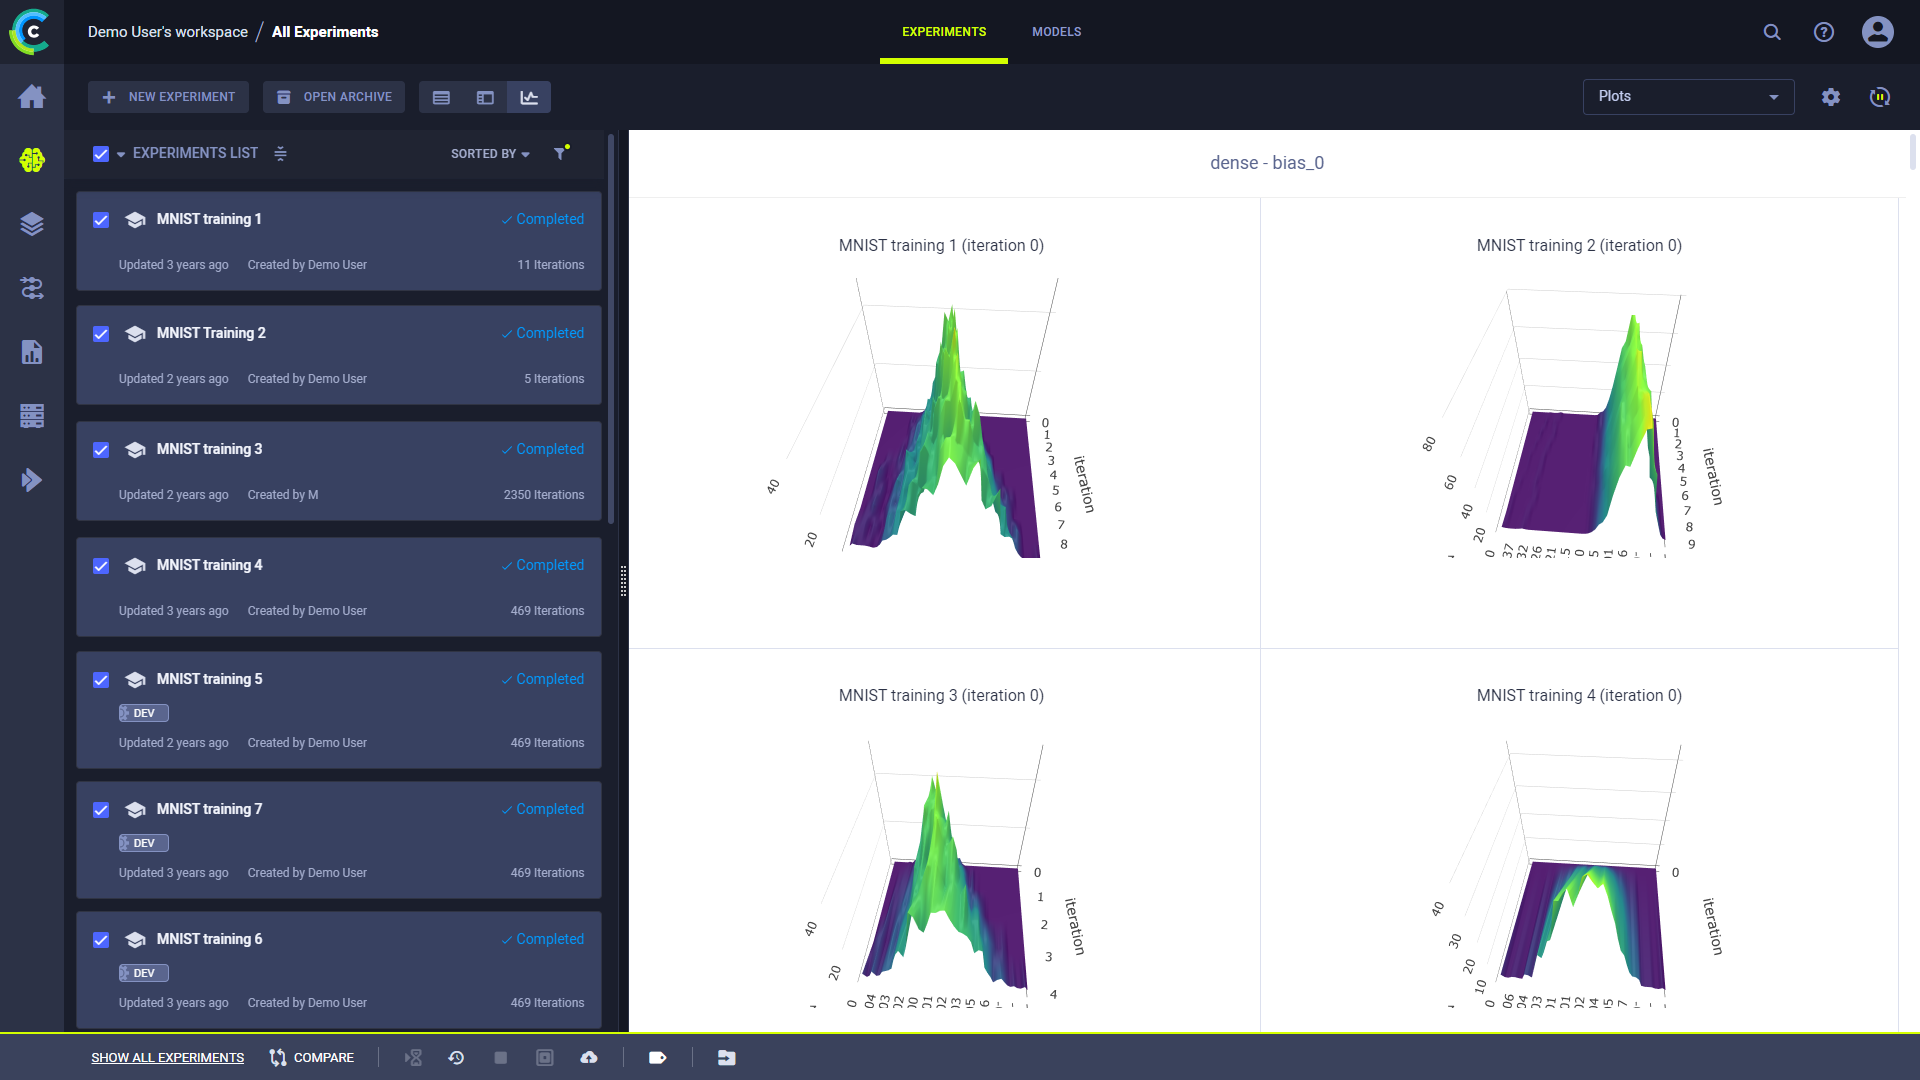
In the dropdown menu, select to view Scalars or Plots. Scalars shows experiments' scalar results as time series line graphs. Plots shows the last reported iteration sample of each metric/variant combination per compared experiment.
Line, scatter, and bar graphs are compared by overlaying each metric/variant from all compared experiments' into a single comparative plot.
Other plot types are displayed separately for each experiment.
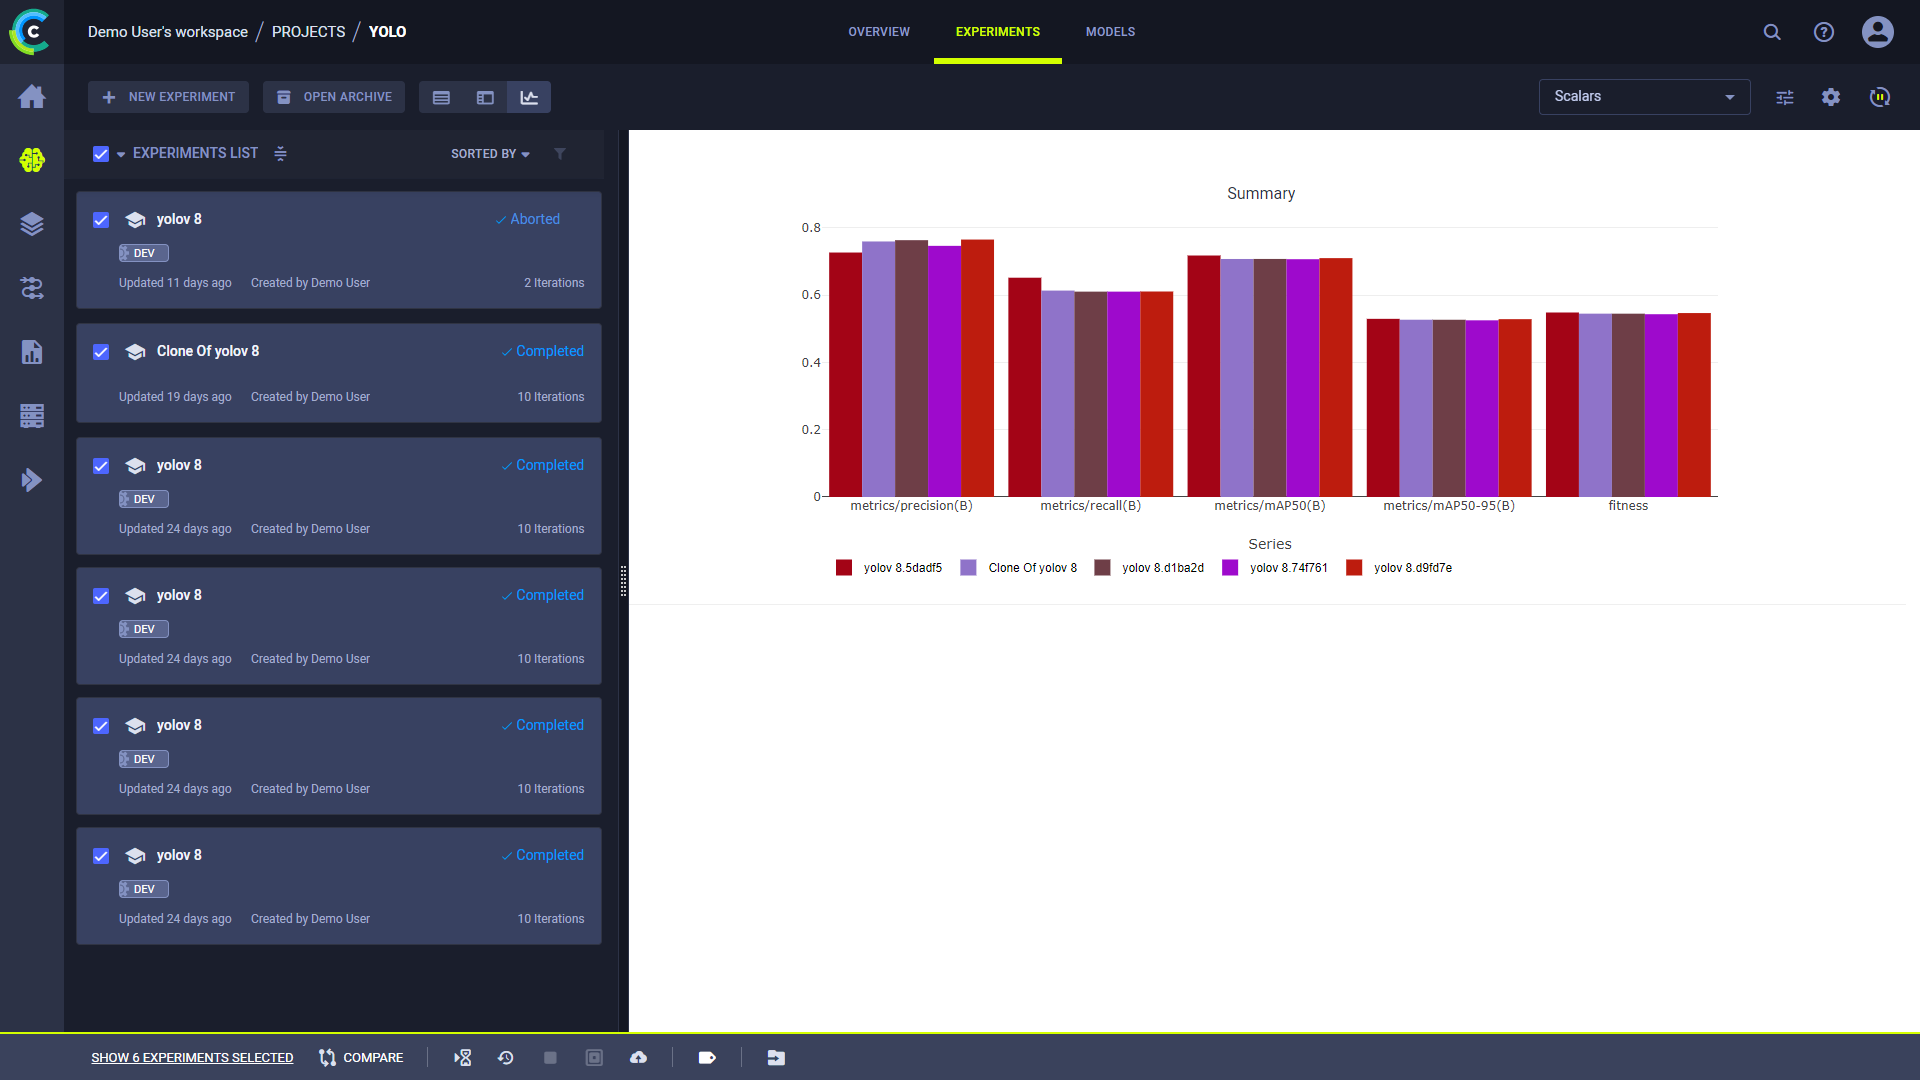
All single value scalars are plotted into a single clustered bar chart under the "Summary" title, where each cluster represents a reported metric, and each bar in the cluster represents an experiment.
Click ![]() to customize which
metrics to view.
to customize which
metrics to view.
In the Scalars view, click ![]() to access
scalar plot tools.
to access
scalar plot tools.
Creating an Experiment Leaderboard
Filter and sort the experiments of any project to create a leaderboard that can be shared and stored. This leaderboard updates in real time with experiment performance and outputs.
Modify the experiments table in the following ways to create a customized leaderboard:
- Add experiment configuration (hyperparameters)
- Edit and add experiments properties
- Add reported metrics, any time series reported metric can be selected, then select the last reported value, or the minimum / maximum reported value.
- Filter based on user (dropdown and select) or experiment types
- Add specific tags and filter based on them.
Now the table can be sorted based on any of the columns (probably one of the performance metrics). Select to filter experiments based on their name by using the search bar.
The final dashboard can be shared by copying the URL from the address bar, this address will replicate the exact same dashboard on any browser. The dashboard can also be bookmarked for later use.