Orchestration Dashboard
This feature is available under the ClearML Enterprise plan
Use the orchestration dashboard to monitor all of your available and in-use compute resources:
- Available and utilized resources global total and by category
- Resource utilization over time
- Resource history event log
- Detailed resource performance metrics
Resource Categories and Groups
The orchestration dashboard shows your workers by groups and categories, specified by the following naming
policy: <category>:<group>:<name>.
When no category is specified, workers are assigned the DEFAULT category.
When no group is specified, workers are assigned the Default Group group.
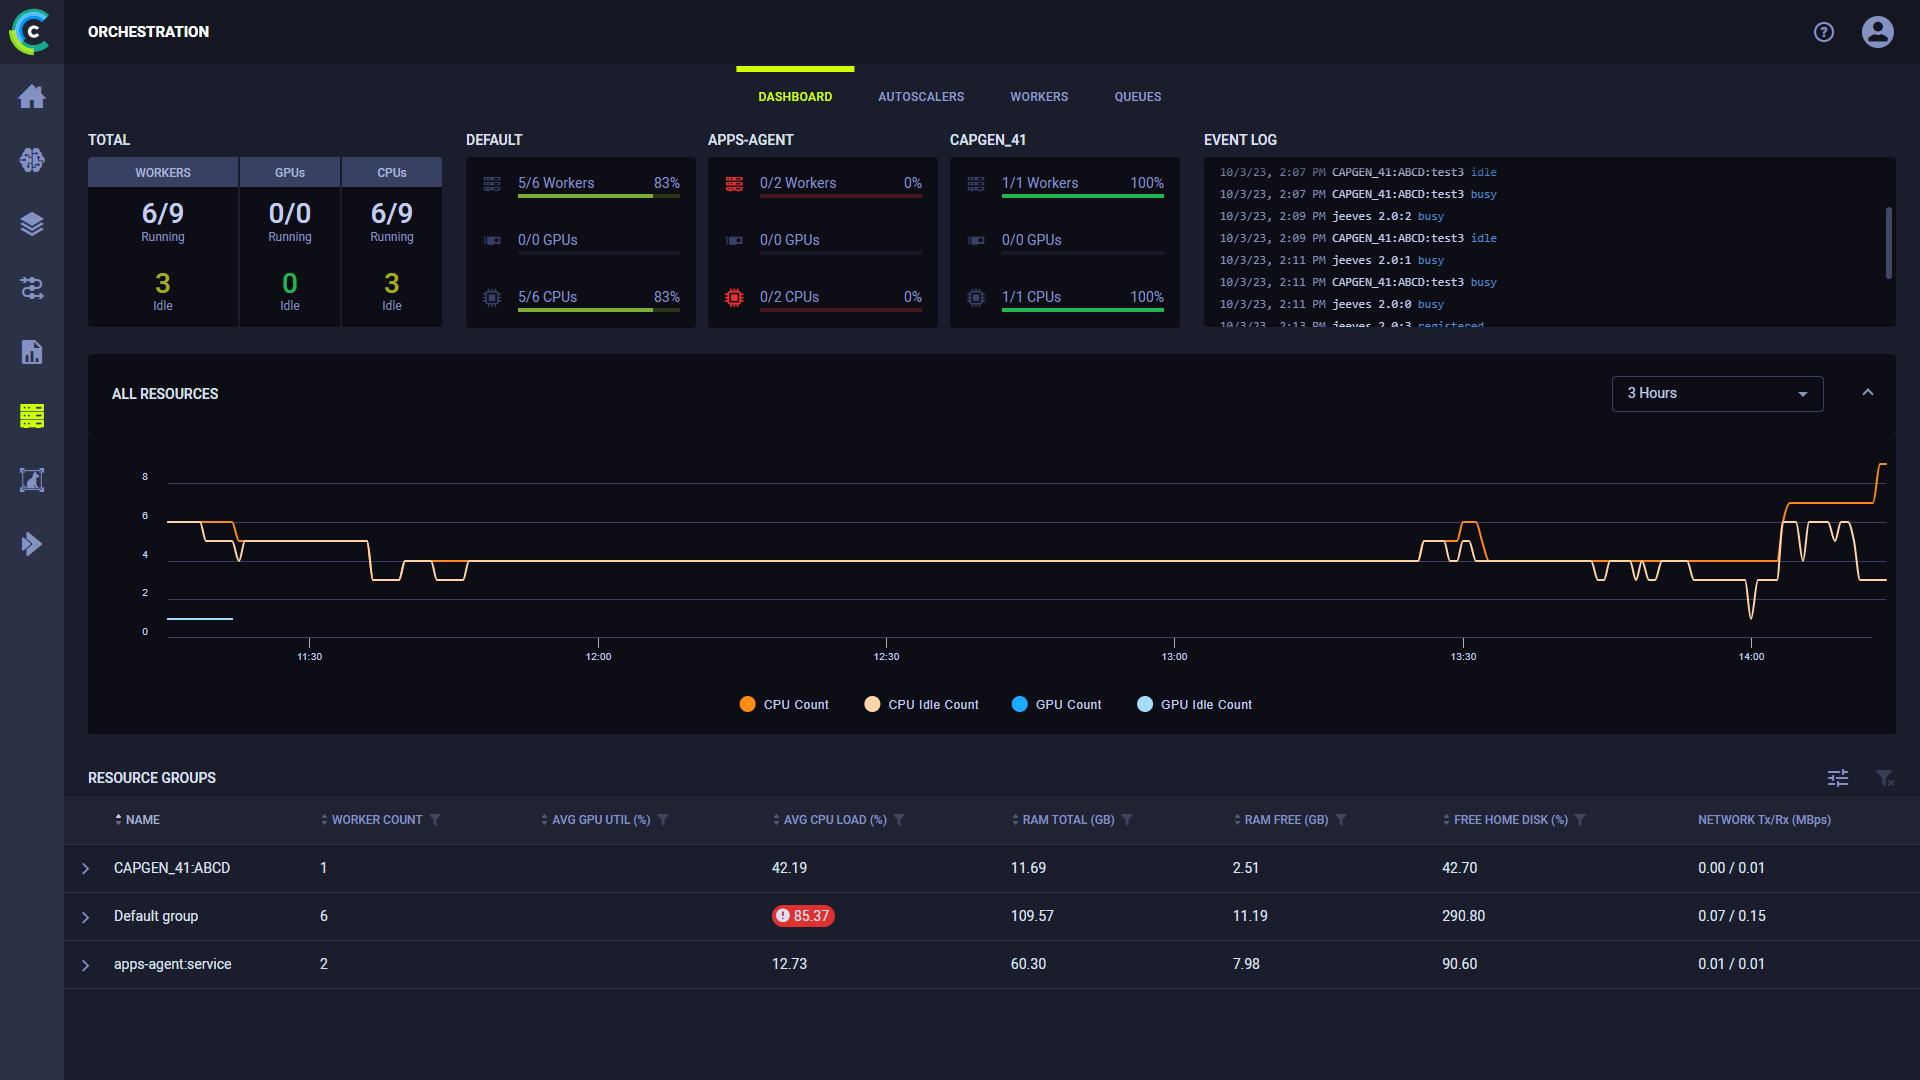
Current Usage Data
The top of the dashboard displays the current resource availability and utilization counts. This gives you an overall picture of the resources available and in use. The Total section displays available and idle resource counts. These counts are also available per worker category.
The Totals section displays:
- GPUs - The total number of GPUs in currently running workers out of the total number of GPUs in all provisioned workers, and the number of idle GPUs. GPUs are considered idle when their average utilization falls below 80%.
- CPUs - The total number of CPUs in currently running workers out of the total number of CPUs in all provisioned workers, and the number of idle CPUs. CPUs are considered idle when their average utilization falls below 30%.
- Workers - The number of currently running workers out of the total number of provisioned workers (through autoscalers or K8S), and the number of idle workers. Workers are considered idle if all of their GPUs and CPUs are idle or if they are not executing any task.
Category sections display the resource count and utilization for:
- Workers
- GPUs
- CPUs
Hover over any of this data to see the number of currently idle machines.
Use the Event Log to view updates of worker events: worker addition/removal, worker has become idle/busy. Hover over
the log to download (![]() )
it or open the expanded view (
)
it or open the expanded view (![]() ).
).
Resource Graph
The Resource graph displays resource usage over time. The graph time span can be controlled through the dropdown menu above the graph (between 3 hours and 1 month). Hover over the plot to see specific data point values.
Click on a group in the Resource Groups list below the graph to have the graph display usage for that specific group.
When viewing a group's usage, you can select what data to view in the dropdown menu at the top of the plot:
- Compute Units - Available/Idle CPUs/GPUs
- Compute Utilization - Average CPU/GPU utilization
- Available Memory - Total and Free RAM
- Free Home Storage
- Network Throughput - Rx/Tx
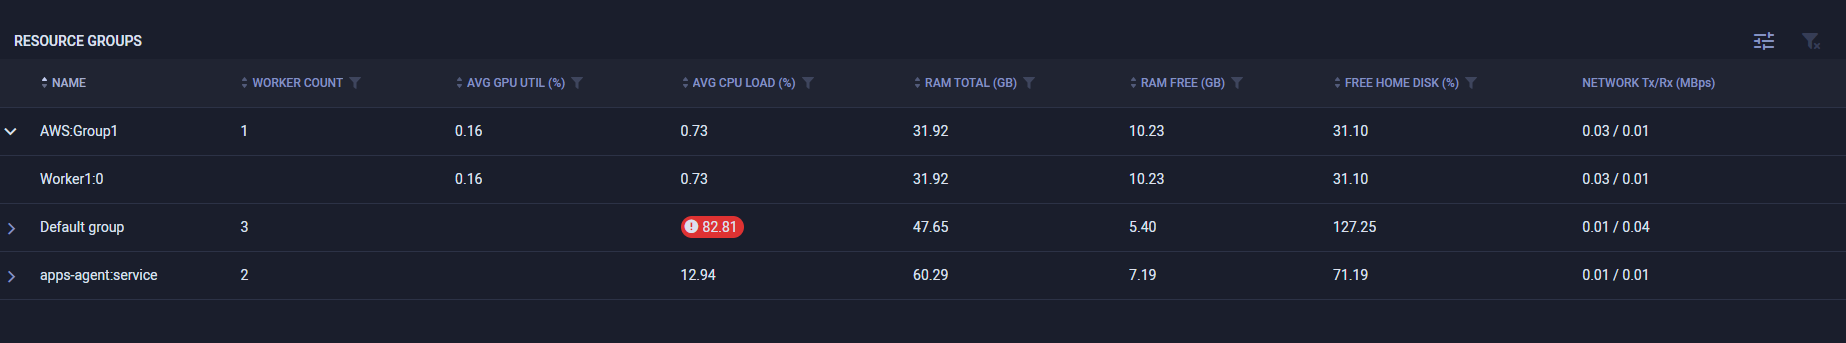
Resource Groups
The Resource Groups table displays current usage numbers for each group:
- Worker count - number of workers in the group
- Average GPU Utilization (%)
- Average CPU Load (%)
- Available (total) RAM (GB)
- Free RAM (GB)
- Free home disk (GB)
- Network (Tx/Rx Mbps)
Click ![]() to expand the resource
group and view the stats of each worker within the group. Filters can be applied by
clicking
to expand the resource
group and view the stats of each worker within the group. Filters can be applied by
clicking ![]() on a column, and the
relevant filter appears. To clear all active filters, click
on a column, and the
relevant filter appears. To clear all active filters, click ![]() .
.
Hover over a worker and click ![]() to access the worker's information panel.
to access the worker's information panel.
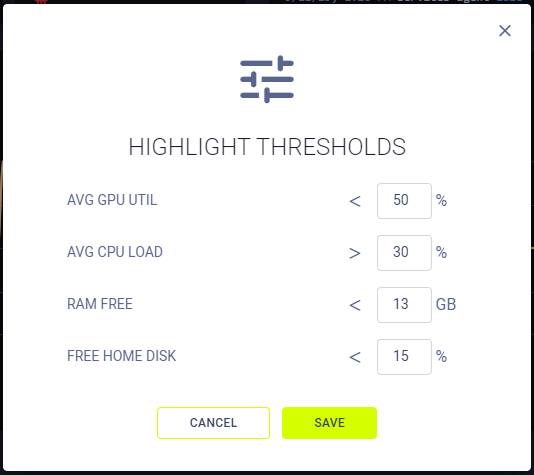
The table highlights values that cross user configured thresholds.
Click ![]() to define the threshold values.
to define the threshold values.
The threshold values applied to the dashboard table affect all workspace users who view the page
Clicking on a resource group opens the group's info panel and replace the Overview graph with that resource's usage history.
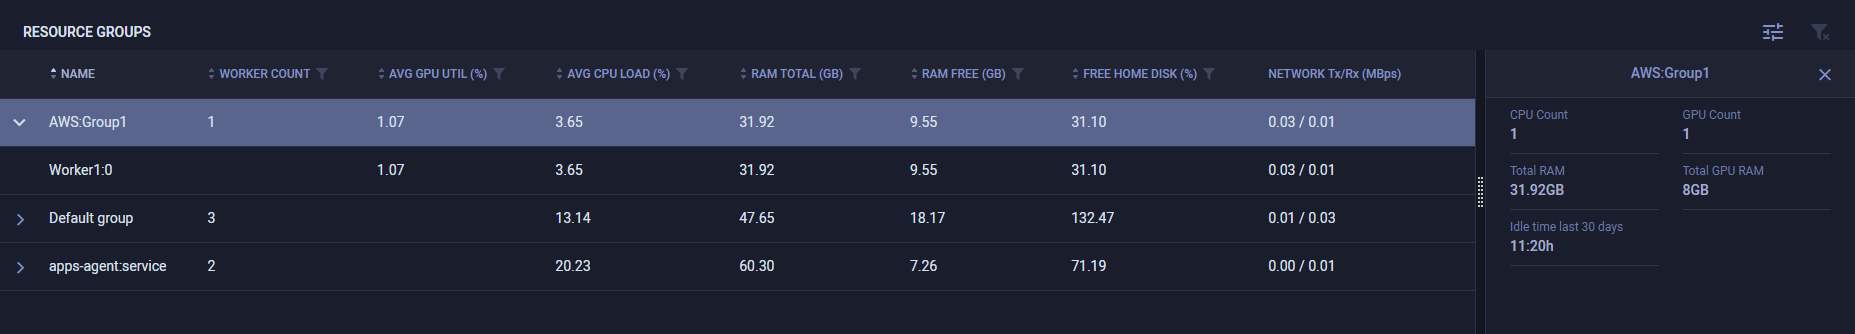
The info panel displays the group's:
- Total GPU count
- Total CPU count
- Total Worker RAM
- Total GPU RAM
- Aggregate Idle time in last 30 days