Matplotlib
The example below demonstrates integrating ClearML into code that uses matplotlib to plot scatter diagrams, and
show images. ClearML automatically logs the diagrams and images.
View the example in script or in Jupyter Notebook.
note
The example in Jupyter Notebook includes a clickable icon to open the notebook in Google Colab.
When the example runs, it creates an experiment named Matplotlib example
in the examples project (in script) or the Colab notebooks project (in Jupyter Notebook).
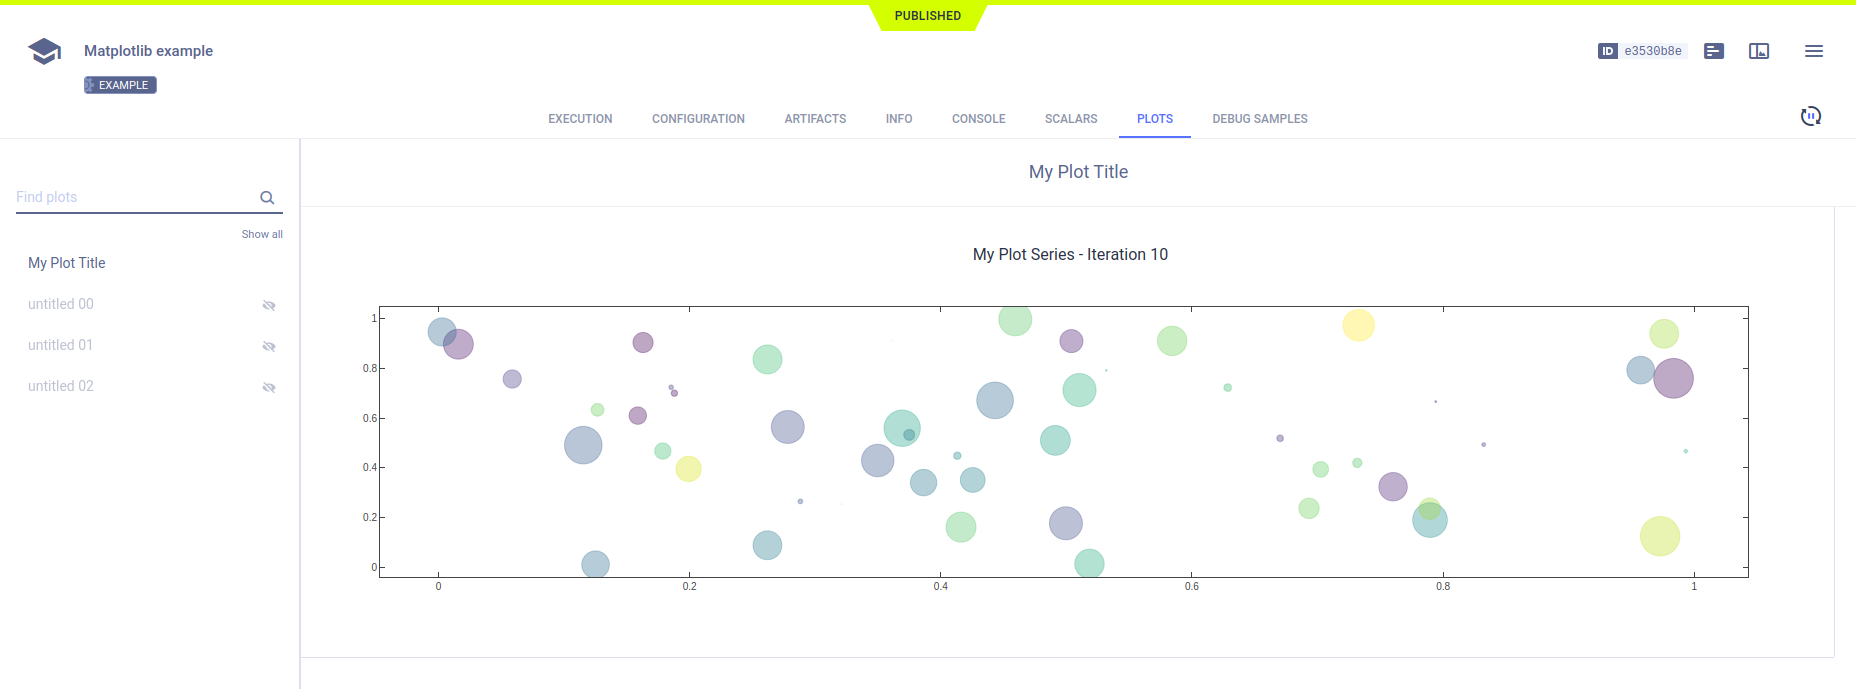
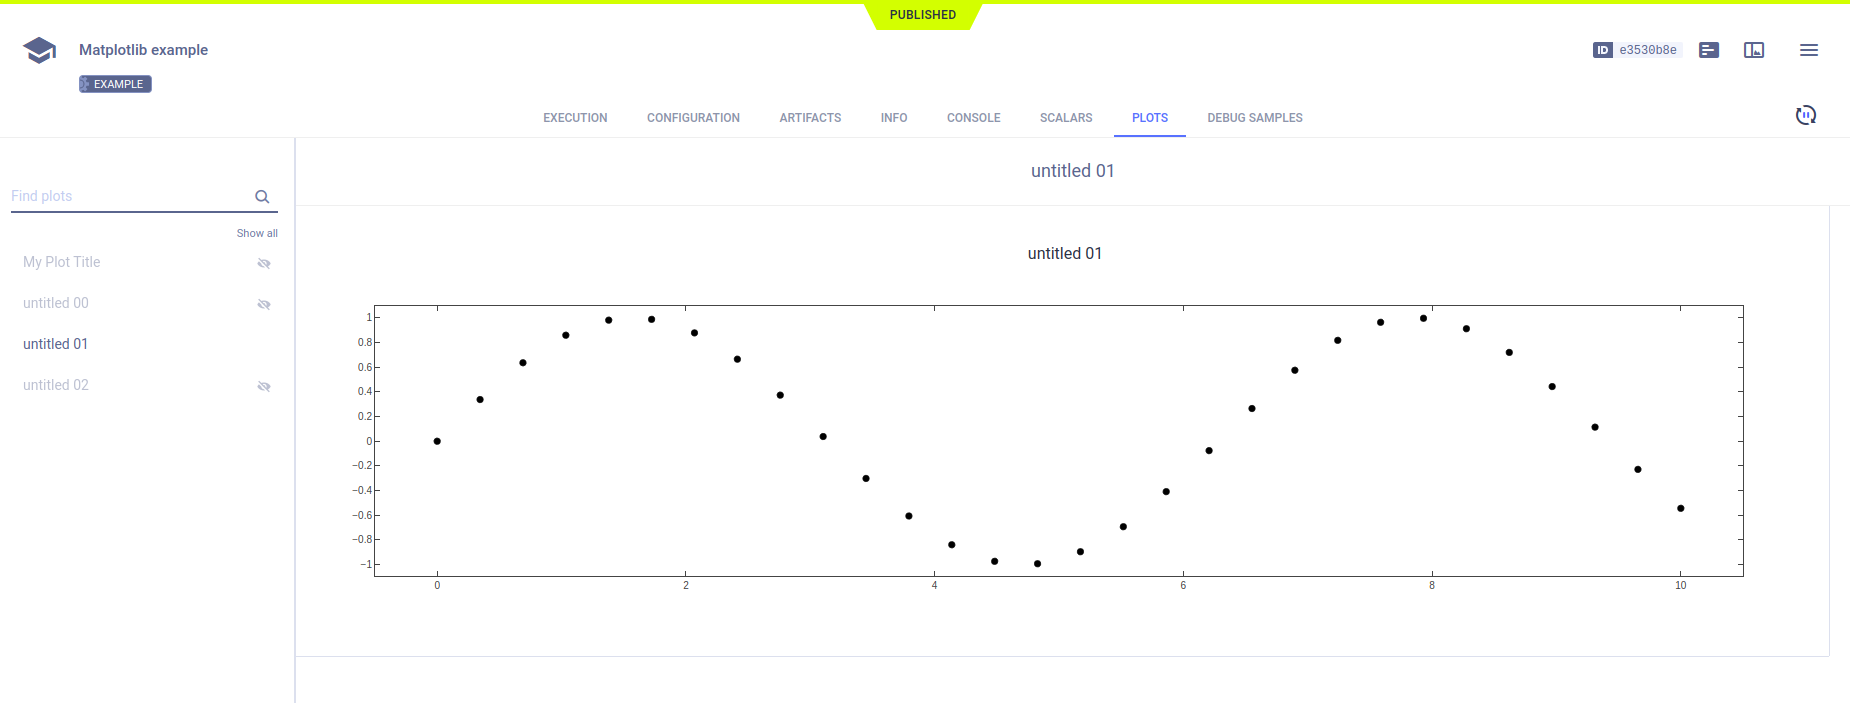
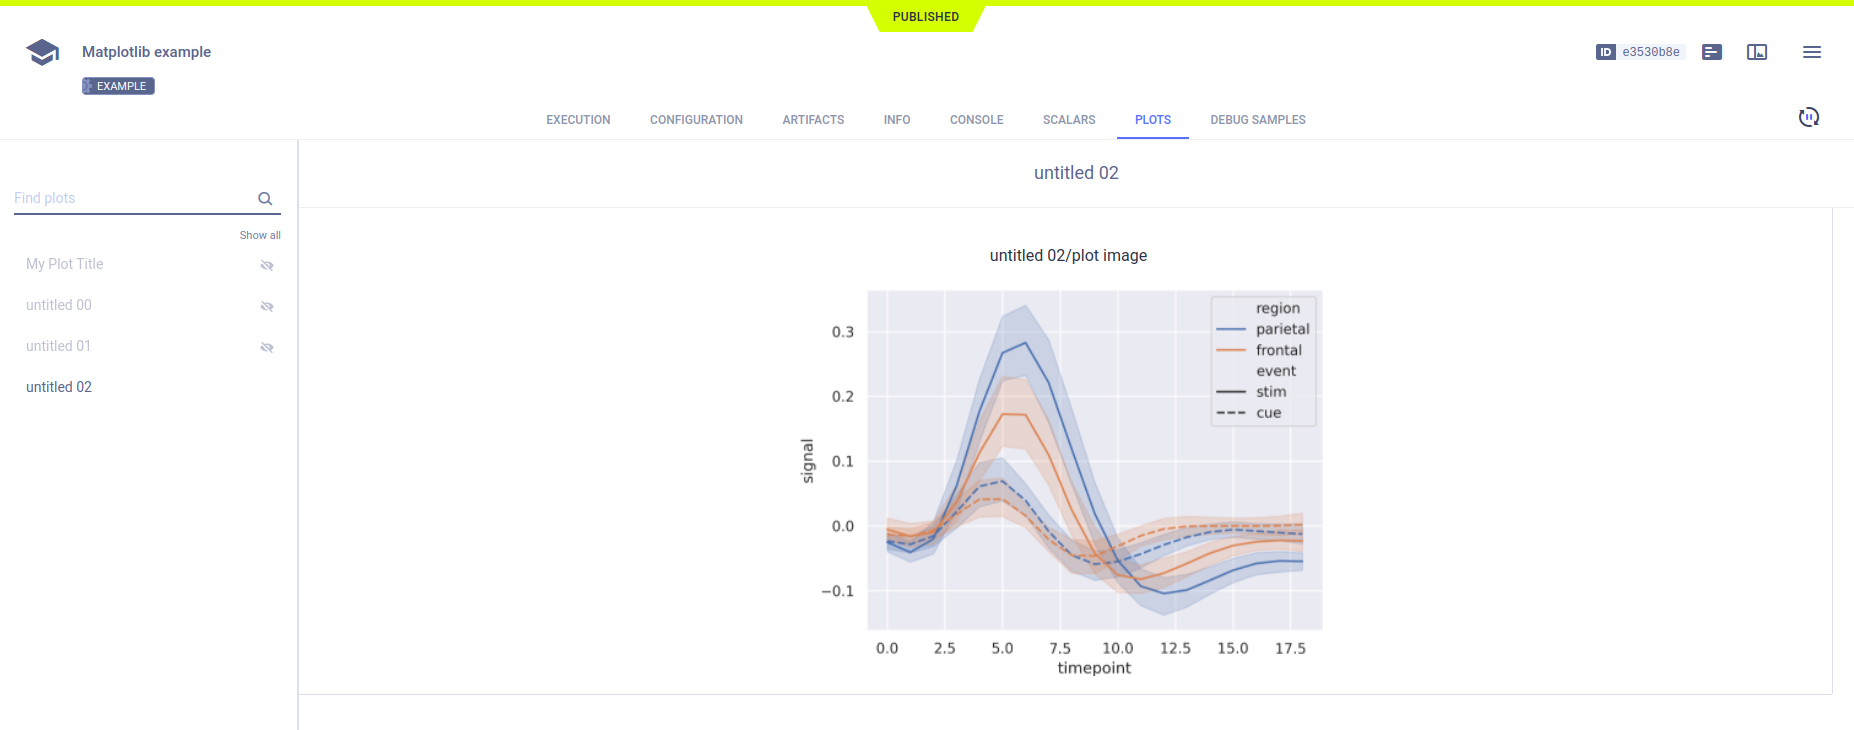
Plots
The scatter plots appear in the ClearML Web UI, in PLOTS.
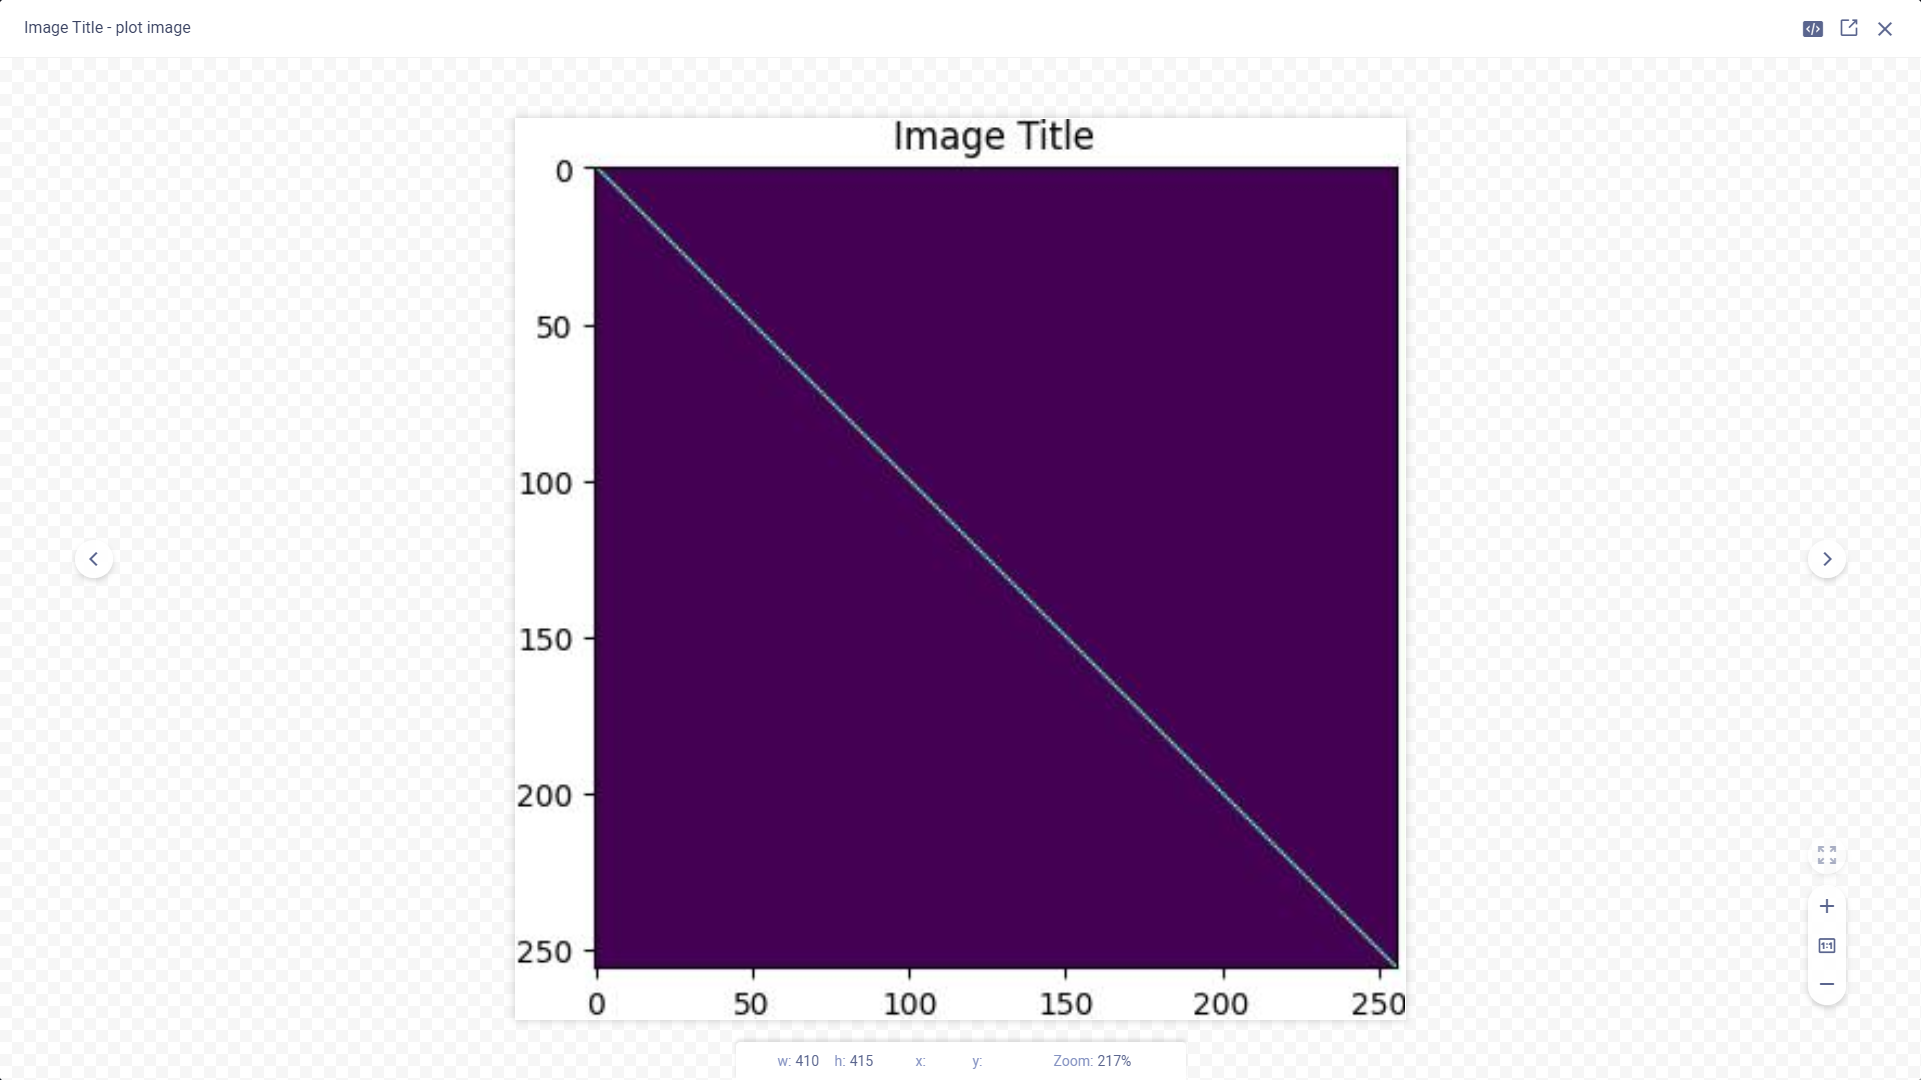
Debug Samples
The images appear in DEBUG SAMPLES. Each debug sample image is associated with a metric.
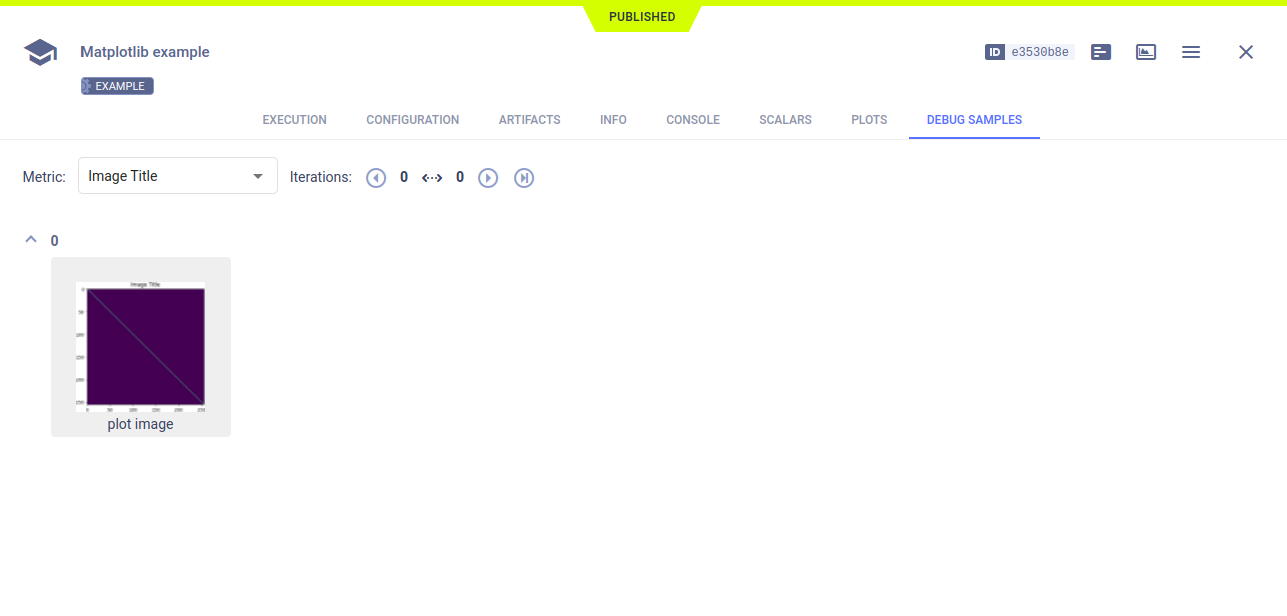
View the debug sample in the image viewer.