A case study of enriching food dataset
Introduction
It has been months ago when Toloka and ClearML met together to create this joint project. Our goal was to showcase to other ML practitioners how to first gather data and then version and manage data before it is fed to an ML model.
We believe that following those best practices will help others build better and more robust AI solutions. If you are curious, have a look at the project we have created together.
Can we enrich an existing data set and make an algorithm learn to recognize the new features?
We have found the following data set on Kaggle and quickly decided it is ideal for our project. The dataset consists of thousands of images of different types collected using MyFoodRepo and has been released under the Creative Commons CC-BY-4.0 license. You can check more details about this data in the official Food Recognition Benchmark paper.
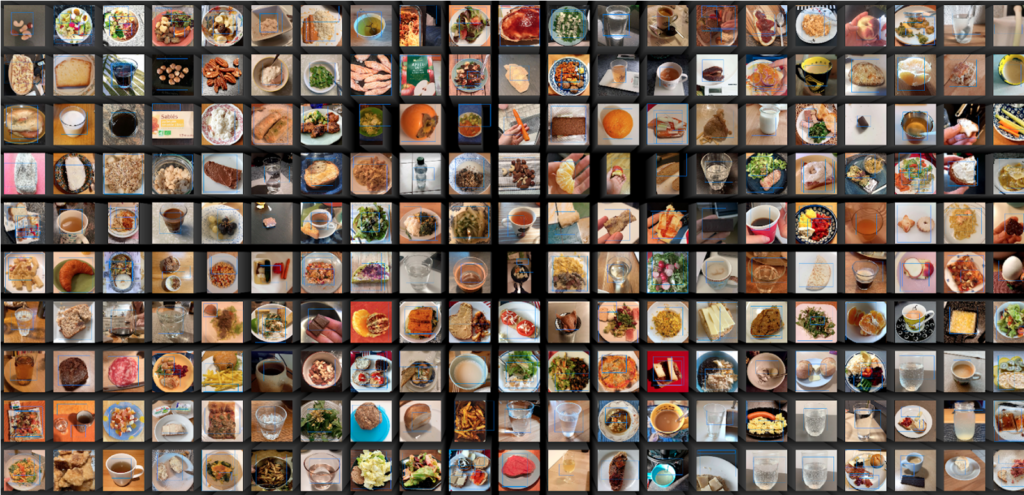
Additionally, we have noticed that some food was…more appetizing than the other.
So can we enrich this data set with this additional information and then make an algorithm that will recognize the new features?
The answer is yes and we did it using Toloka and ClearML.
For this step, we have used Toloka crowdsourcing platform. It is a tool where you can create an annotation project that is then distributed to remote annotators all over the world.
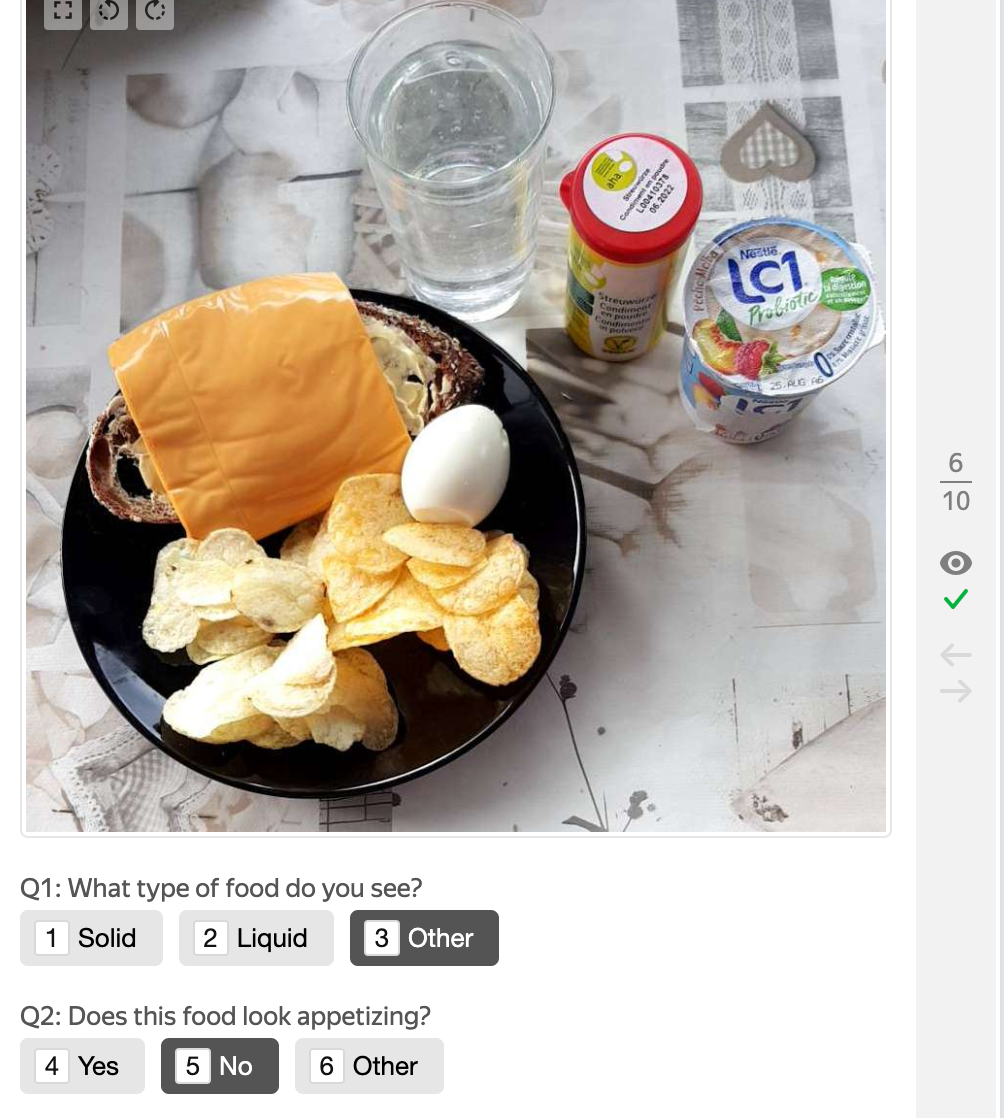
The first step in the project was to create the interface and detailed instructions. In this case, we wanted to ask two questions:
- objective question: about the type of food, either solid or liquid
- subjective question: about if a person finds the food appetizing or not
We have used the interface that you can see below:
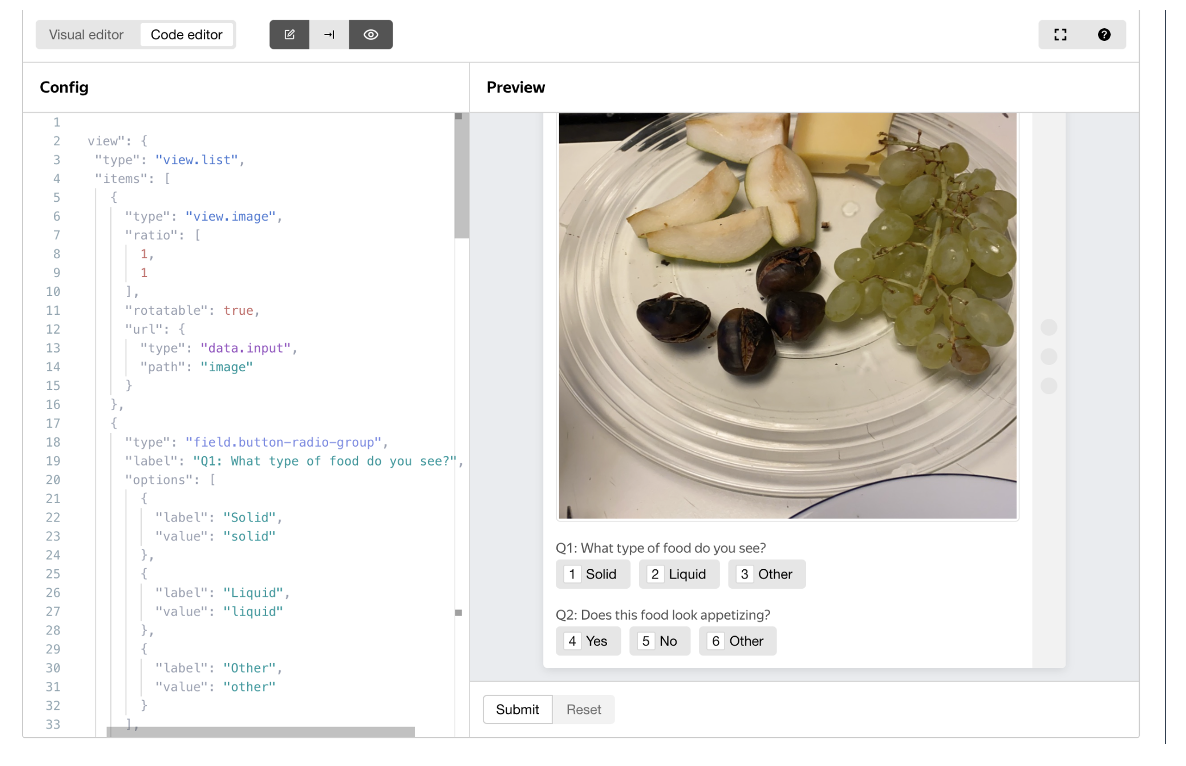
Additionally in the instructions, we have clearly specified what solid and liquid food are, gave examples of those, and provided edge cases.
Once instructions and interface were ready we had to invite performers for our project. Toloka annotators are all over the world so we had to carefully choose who will be able to take part in our project.
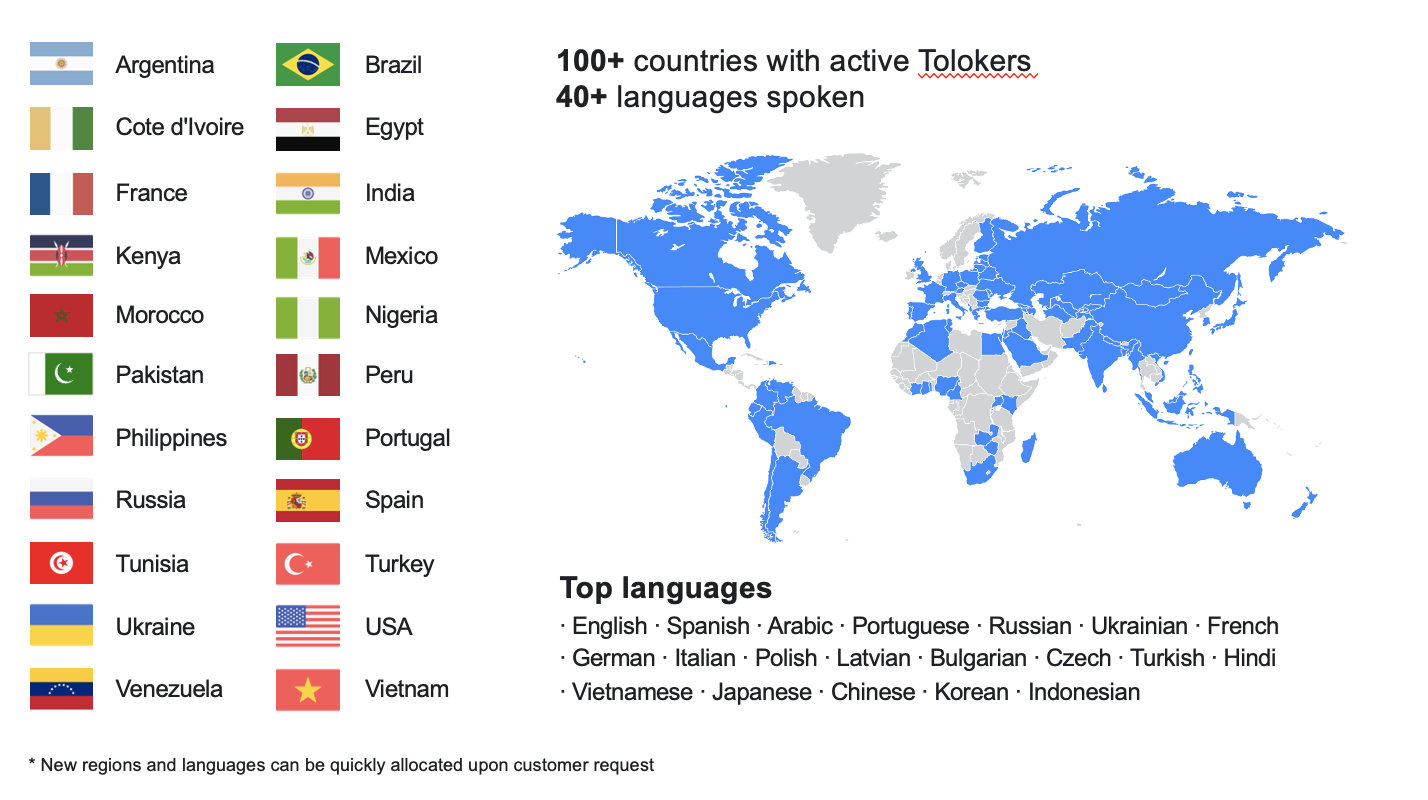
Because the instructions we gave were written in English we decided to only invite English speakers and test how well they understand them using the exam. The exam consisted of 10 tasks on which we tested the answer to our first question about food type. We had 5 solids, 4 liquids, and 1 edge case that should be marked as other. We required 100 % score on the exam to enter the annotation project.
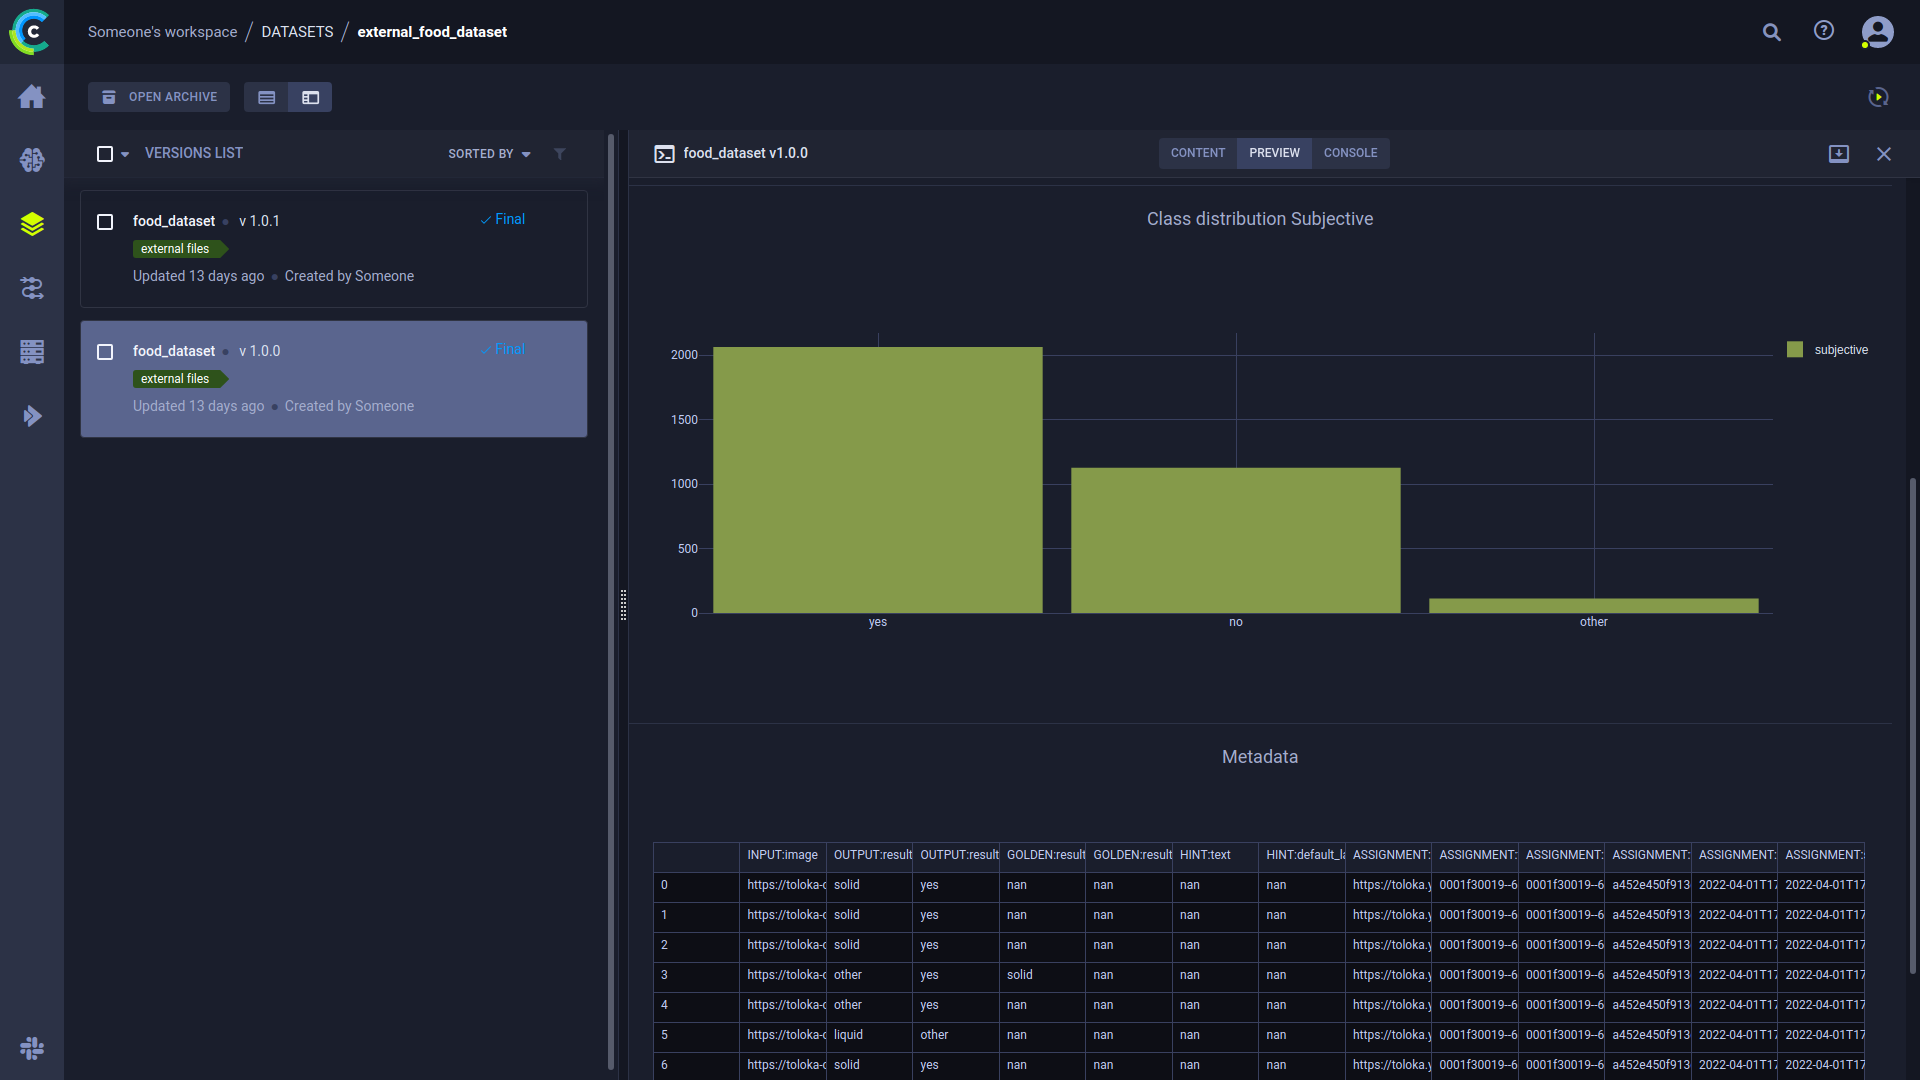
The picture below shows the distribution of the answers given by people who took part in the exam.
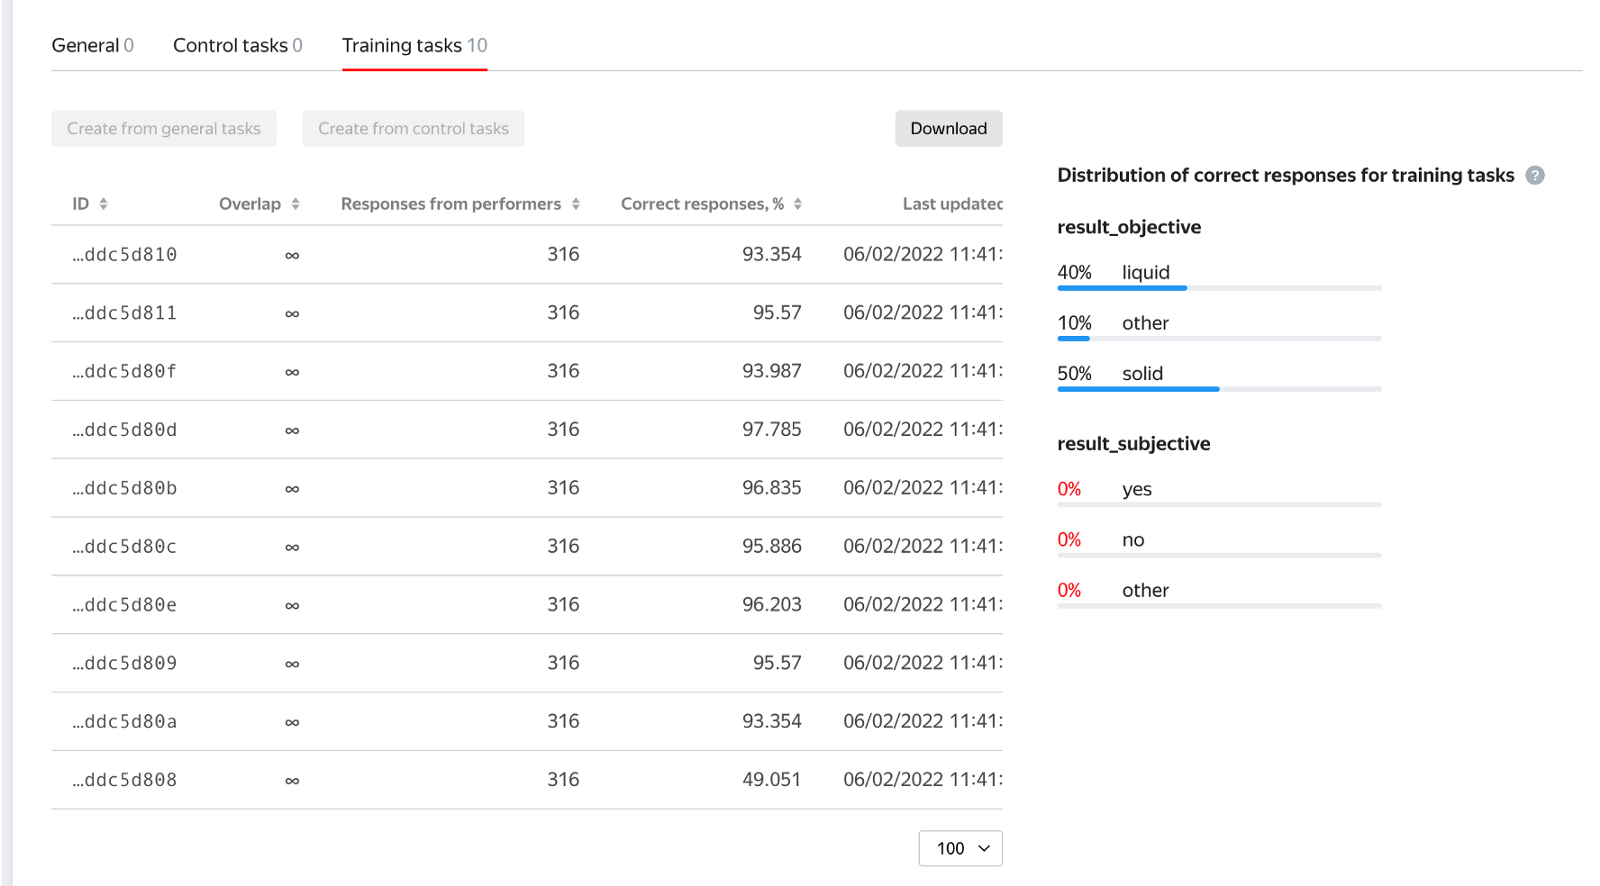
Luckily we filtered out people who answered this question incorrectly.
The next measures that we implemented in order to control the quality of the annotations were using:
- fast response rule,
- overlap,
- and control tasks.
The fast response rule is used when a user responds too fast to a given task. This means that he did not even have time to look and examine the task properly and he is unlikely to be given the right responses.
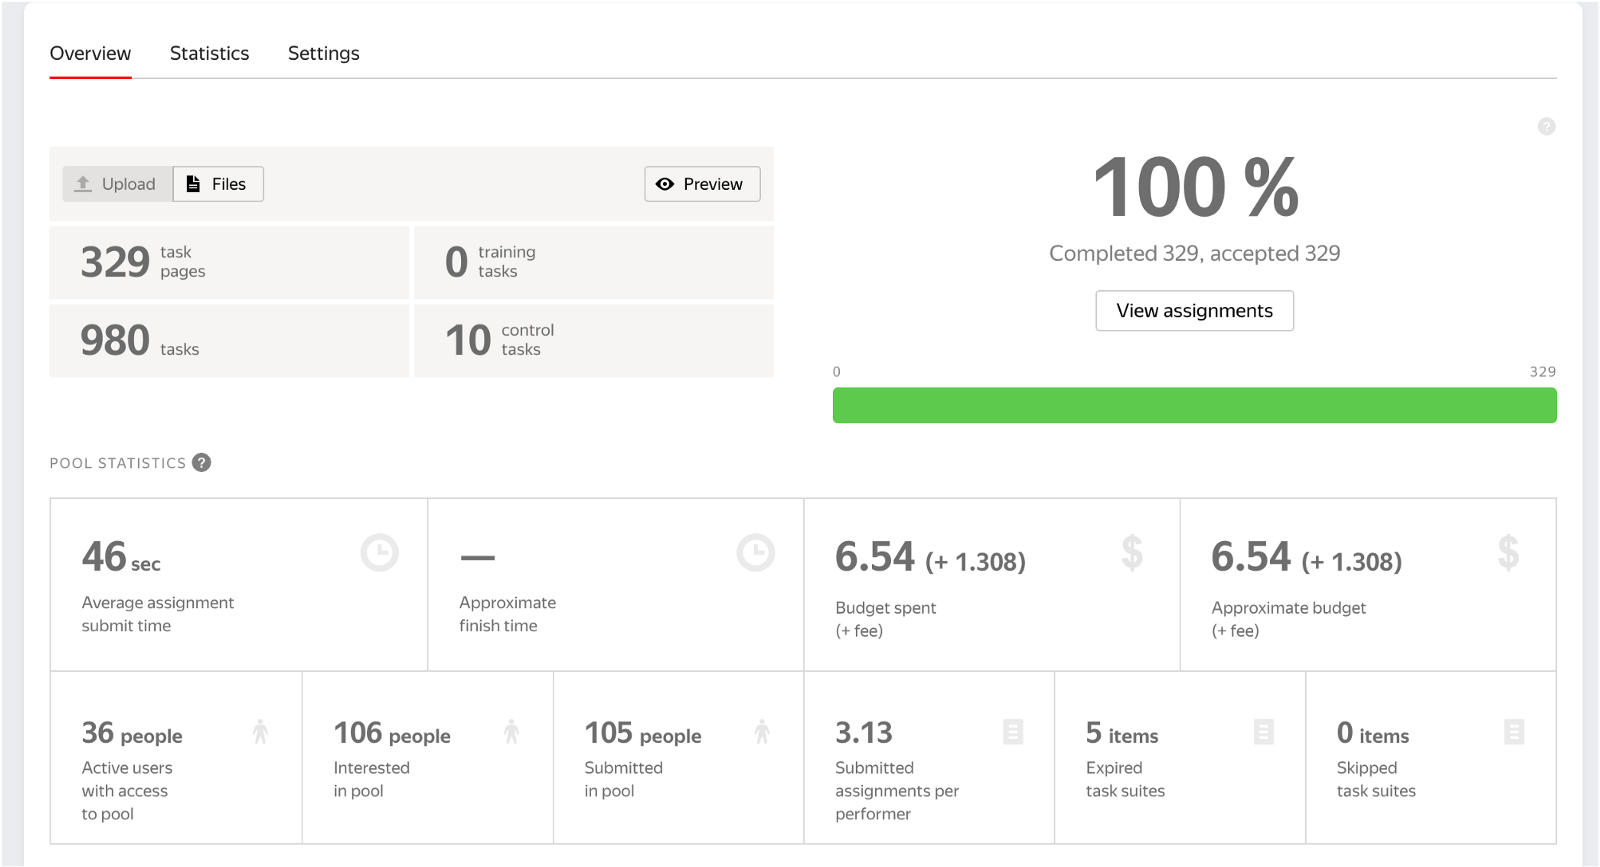
Overlap on the other hand gives us more confidence about the response because each task is distributed to several annotators and their efforts can be aggregated. In this case, we have used an overlap of three.
We have also distributed control tasks between the normal tasks. This means that for every nine tasks given to the annotator there would be one control task checking if the response he gives is correct. If the annotator gave the incorrect response to the control task he was removed from the project.
As a result of this annotation, we have annotated 980 pictures using three unique annotators for each. It took around 30 minutes to gather the results and cost 6.54 $. We also had a total of 105 people that participated in the project.
The results can be now passed to ClearML tools that will be used to version and analyze the data gathered. If your project requires other types of annotations you can browse different annotation demos here.
Data Management
ClearML, an open source MLOps platform, provides a data management tool called ClearML Data, which integrates seamlessly with the rest of the platform.
Once an annotated dataset is created we just register it into ClearML.
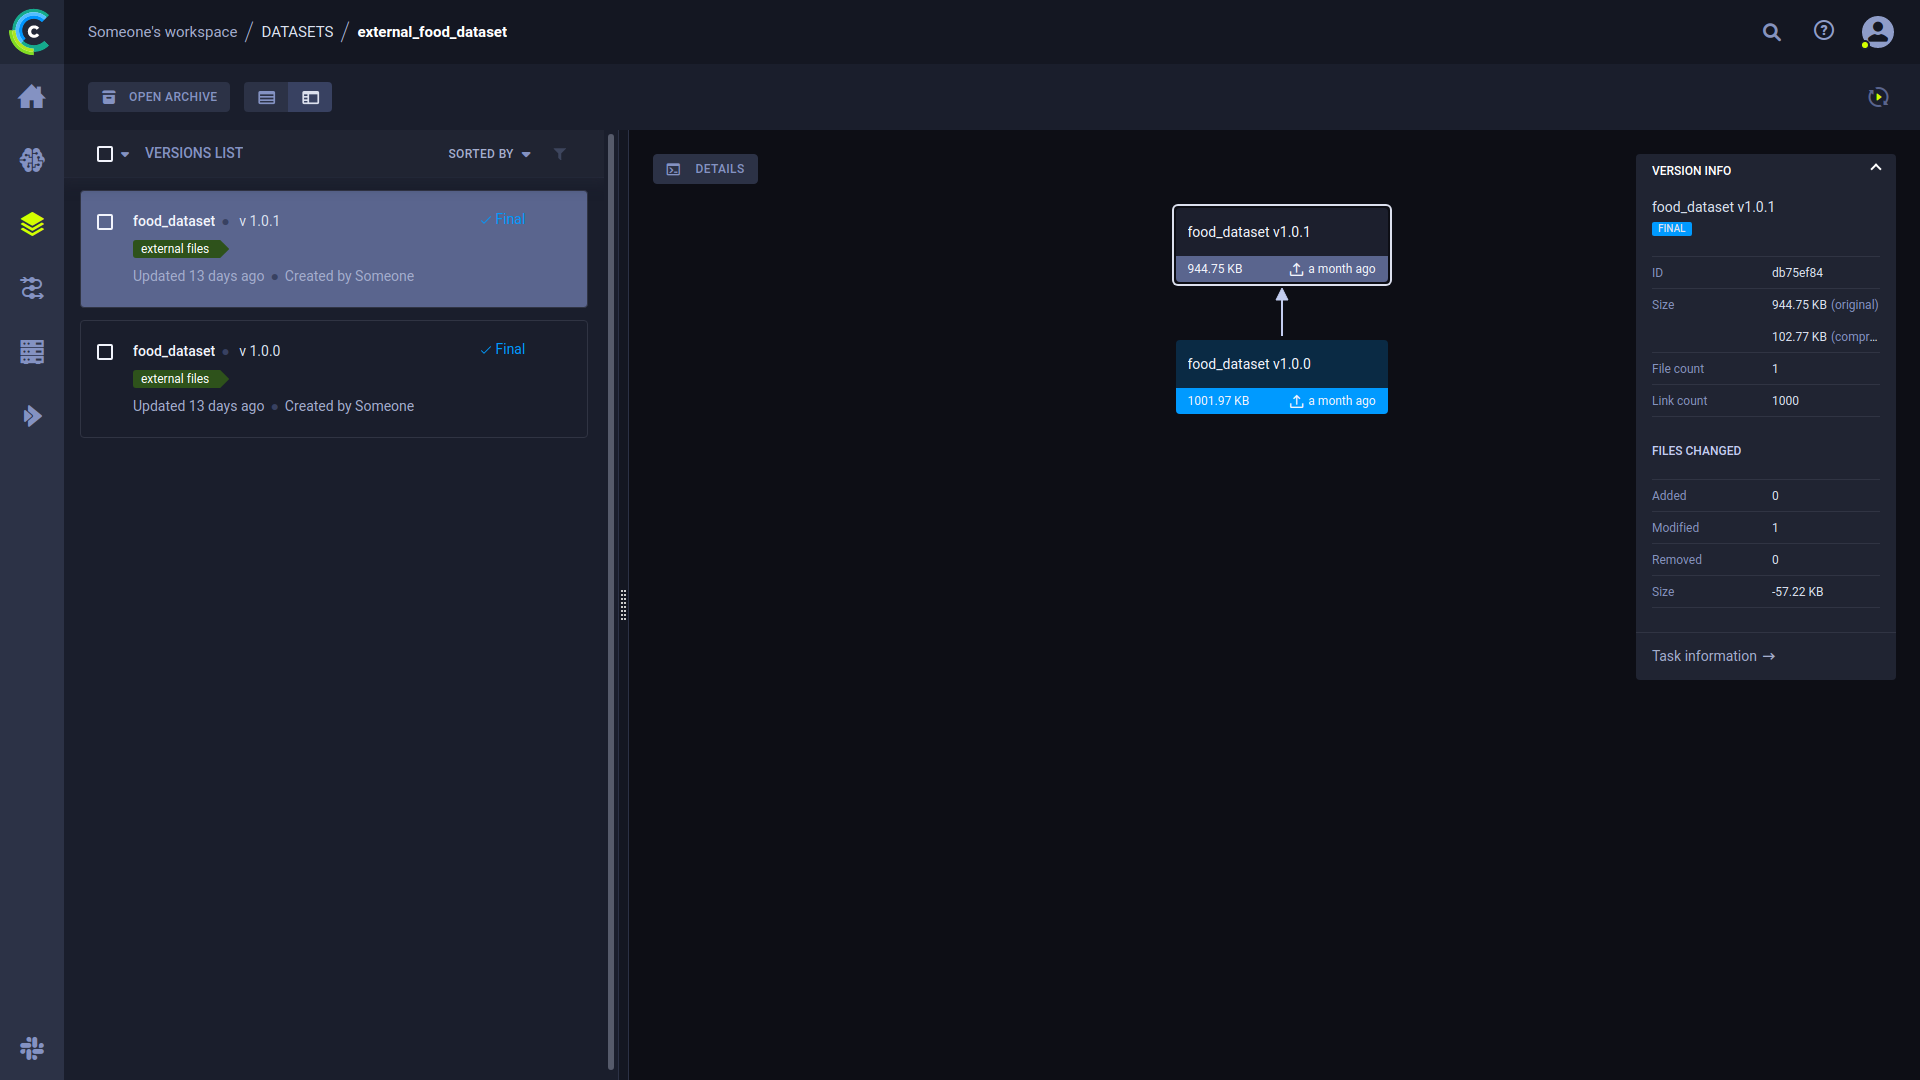
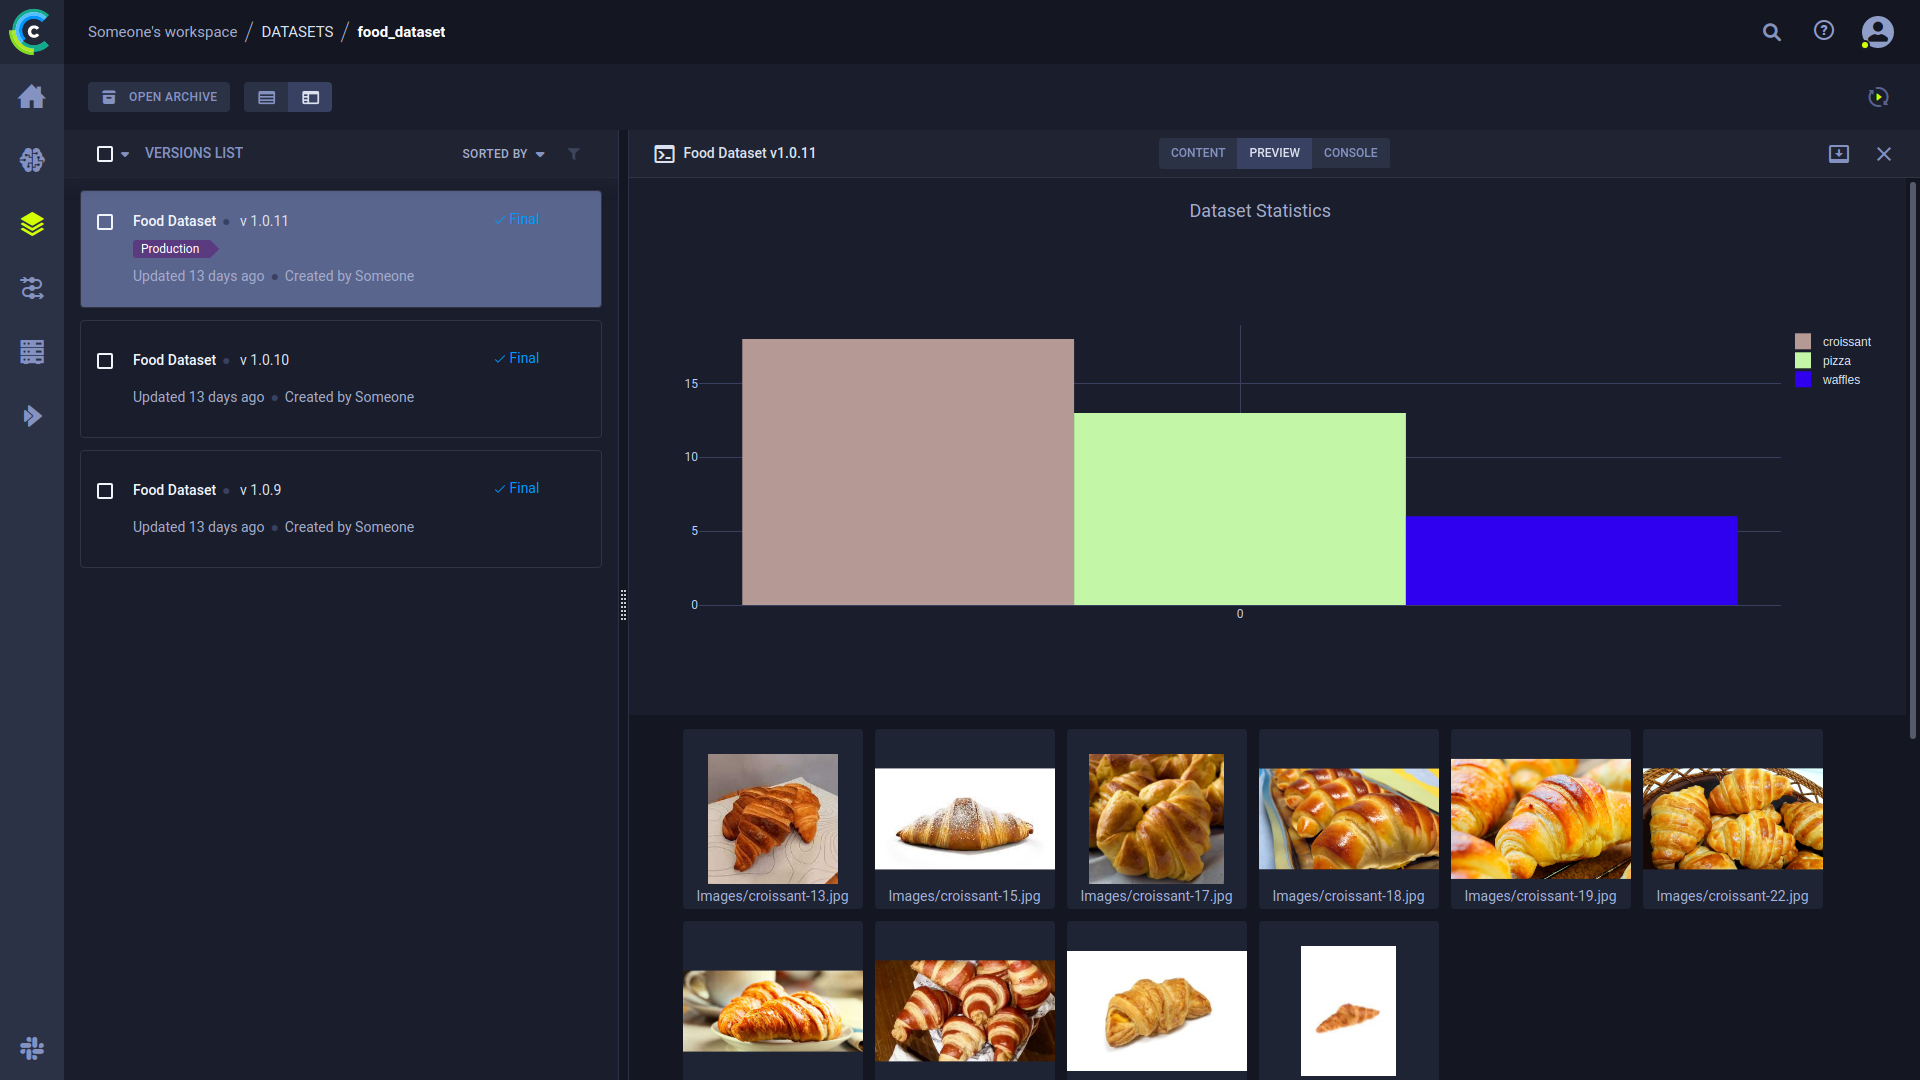
Once Data is registered in ClearML, users have the ability to create and view data lineage trees, add data previews, metadata and even graphs such as label distribution! This means that all the information is encapsulated in a single entity.
In our case, we can save the Dataset annotation cost as metadata. We can also store other annotation parameters such as instructions, language parameters or anything else and attach it to the Dataset so we can refer to it later.
Data is tracked now what?
Ok so now data is tracked and managed, but what’s next you might ask.
Well, here comes the power of connecting it to the ClearML experiment management solution!
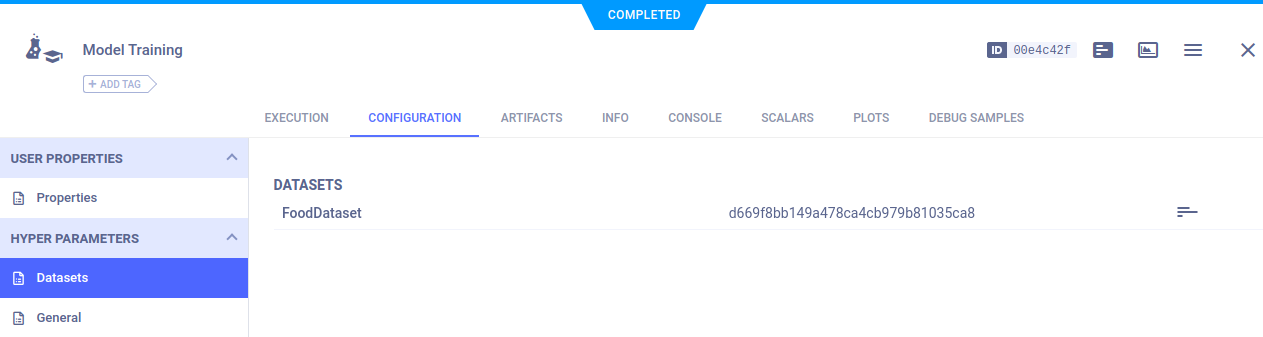
With a single line of code, users can get the dataset to their target machine, completely abstracting where the data is actually stored (either on a dedicated ClearML server, or just stored on your favorite cloud provider’s storage)
ClearML Data fetches the data for you from wherever it is stored, and caches it so consecutive runs do not require re-downloading the data!
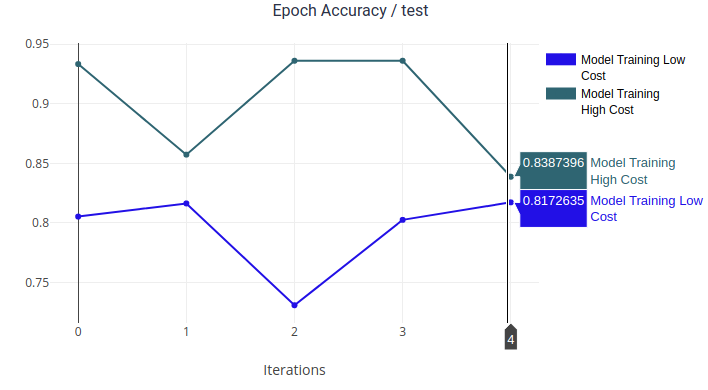
Connecting to ClearML’s experiment management solution allows users to enjoy all the features it has to offer, like experiment comparison, we can compare 2 experiments where the only difference between is the cost for annotations and actually see what affect paying more for annotations has on our model!
And since we saved cost as metadata, if we automated the annotation tasks using Toloka’s SDK, we can actually combine Toloka and ClearML to run a hyperparameter optimization on annotation costs automatically and figure out how much should we really invest in annotations!
Level up your data management with Hyper-Datasets
Need to get more out of your Dataset Management tool? Check out Hyper-Datasets!
Hyper-Datasets essentially stores annotations and metadata in a database so it can be queried at train \ test time!
Users can connect queries on Data, called DataViews, to an experiment and version these as well! Using Datviews allows you to easily get only specific subsets of your dataset (or even multiple datasets) when needed, this provides another level of granularity on data management.
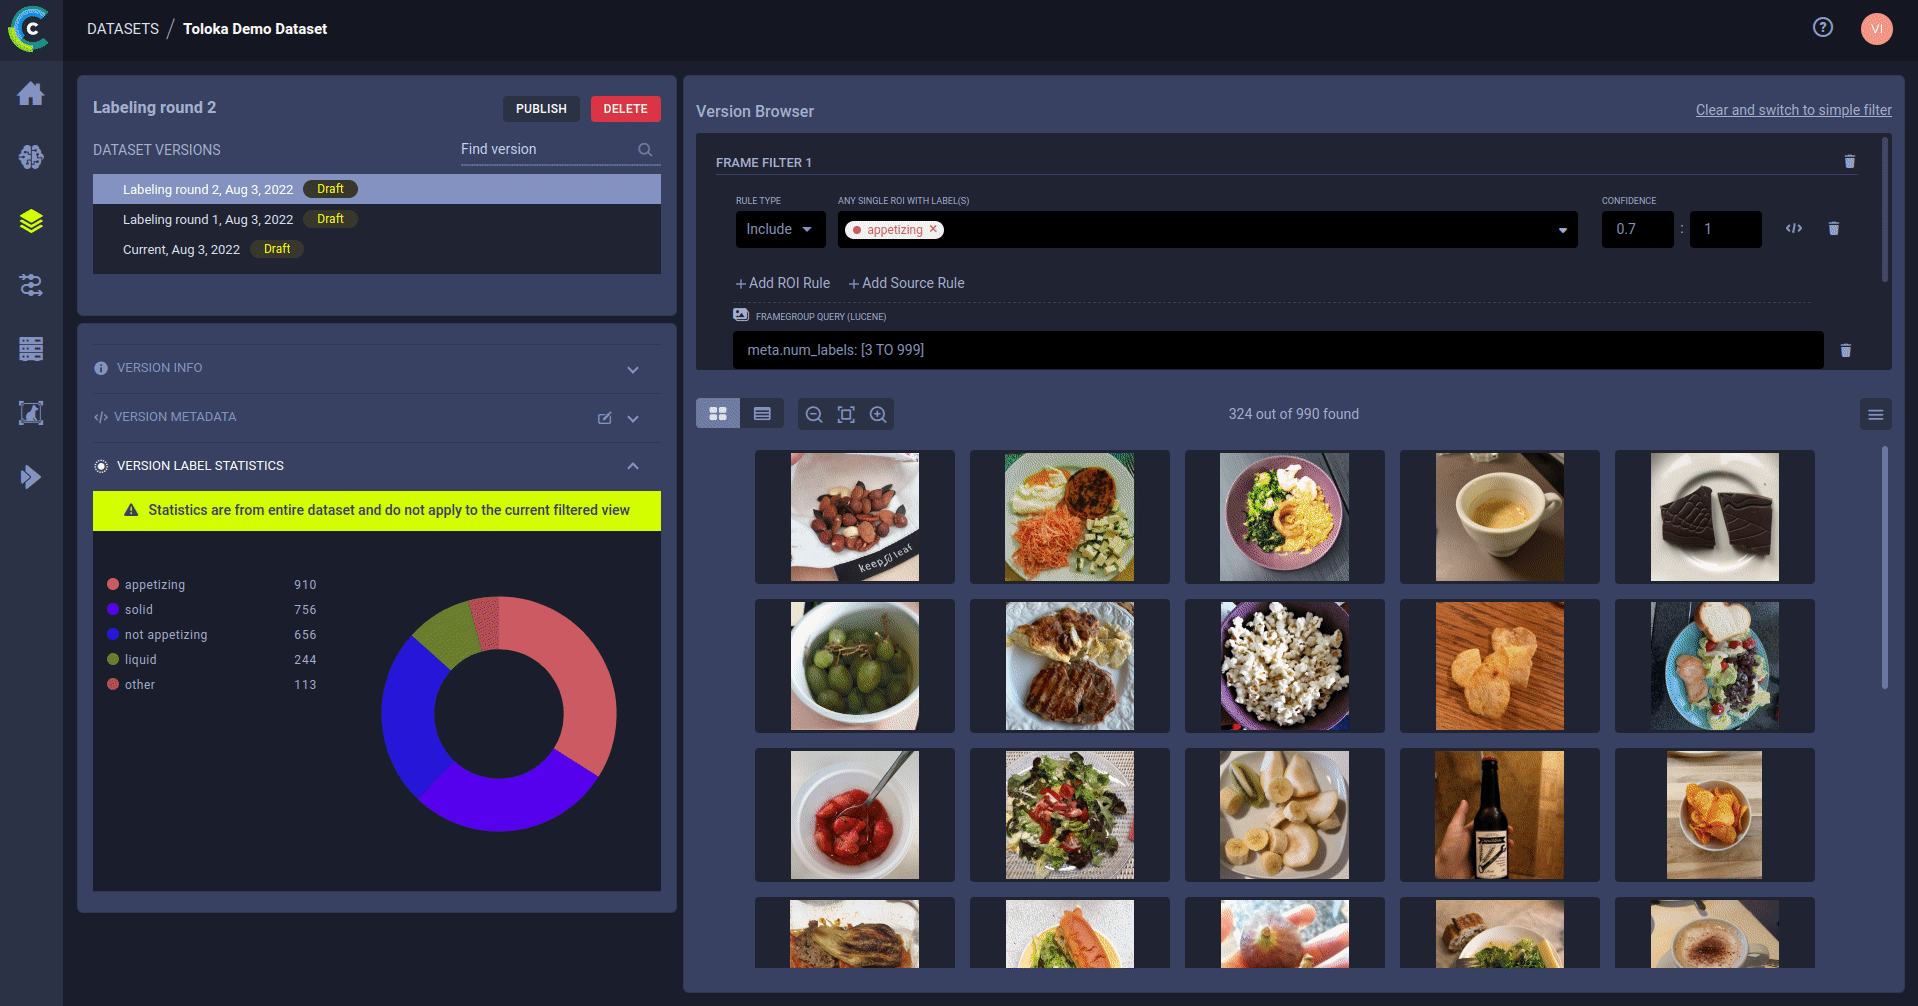
DataViews and Hyper-Dataset are great if you need better statistics on your data, better control into what data your networks are fed and if you work on subsets of your data and want to avoid data duplication (which is both storage and management hungry).
In this article, you have learned how to use Toloka and ClearML tools to build your ML data workflows on the example of a food data set. If you want to check all the code needed for the steps outlined in this blog check the colab notebook we have prepared.
Additionally, we have presented the results of our experiments in a form of a webinar and saved the recordings for you (Toloka part, ClearML part).
Do you find this guide useful to manage data for your own ML projects? Please comment below if you have any feedback or want to ask questions about this project.
This blog post was written by Magdalena Konkiewicz, Data Evangelist at Toloka, and Victor Sonck and Erez Schnaider here at ClearML. The original article appeared here.