Tables Reporting (Pandas and CSV Files)
The pandas_reporting.py example demonstrates reporting tabular data from Pandas DataFrames and CSV files as tables.
ClearML reports these tables, and displays them in the ClearML Web UI > experiment details > PLOTS tab.
When the script runs, it creates an experiment named table reporting in the examples project.
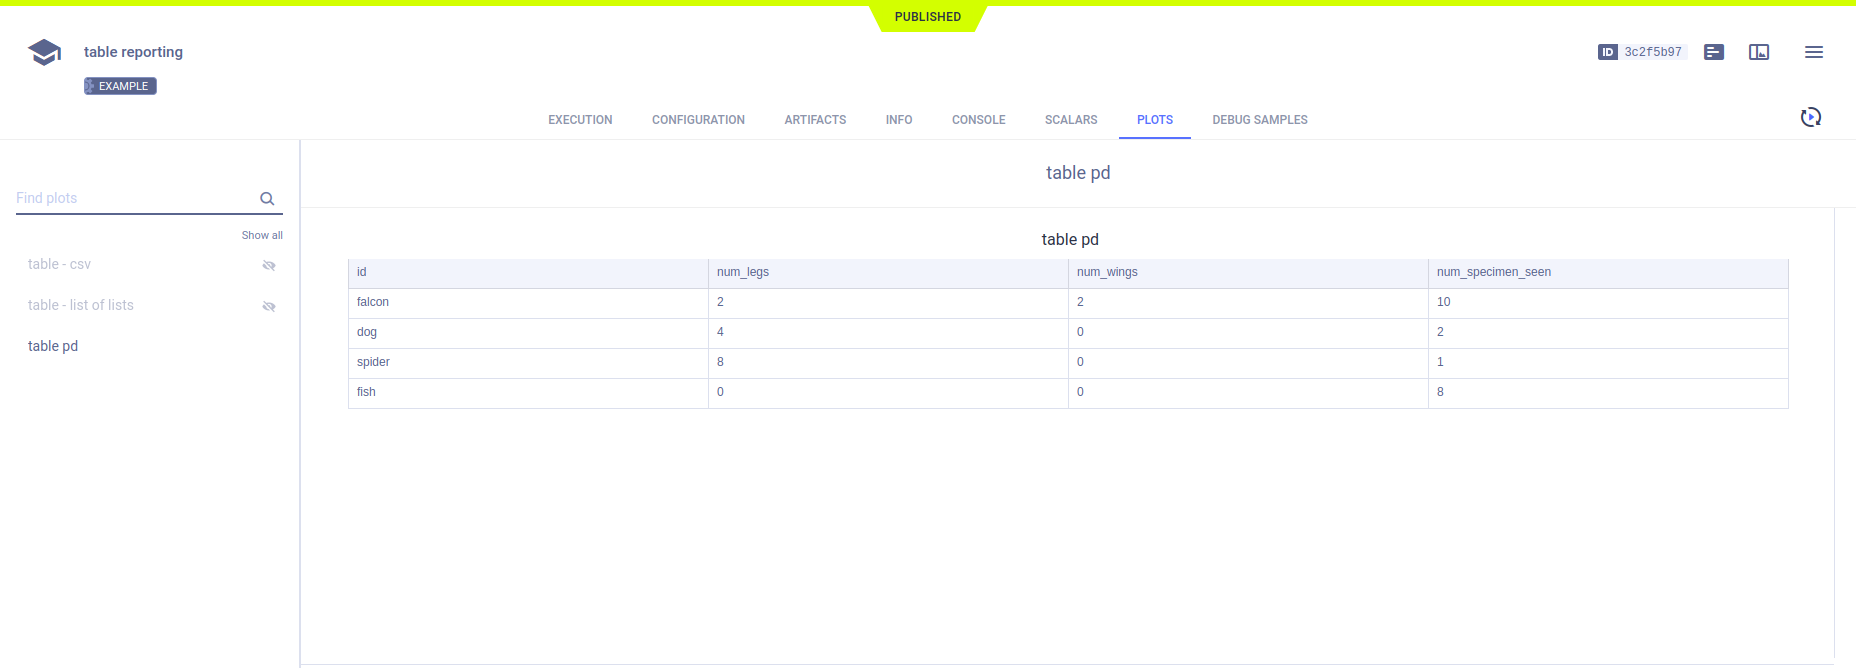
Reporting Pandas DataFrames as Tables
Report Pandas DataFrames by calling Logger.report_table(),
and providing the DataFrame in the table_plot parameter.
# Report table - DataFrame with index
df = pd.DataFrame(
    {
        "num_legs": [2, 4, 8, 0],
        "num_wings": [2, 0, 0, 0],
        "num_specimen_seen": [10, 2, 1, 8],
    },
    index=["falcon", "dog", "spider", "fish"],
)
df.index.name = "id"
Logger.current_logger().report_table(
    "table pd",
    "PD with index",
    iteration=iteration,
    table_plot=df
)
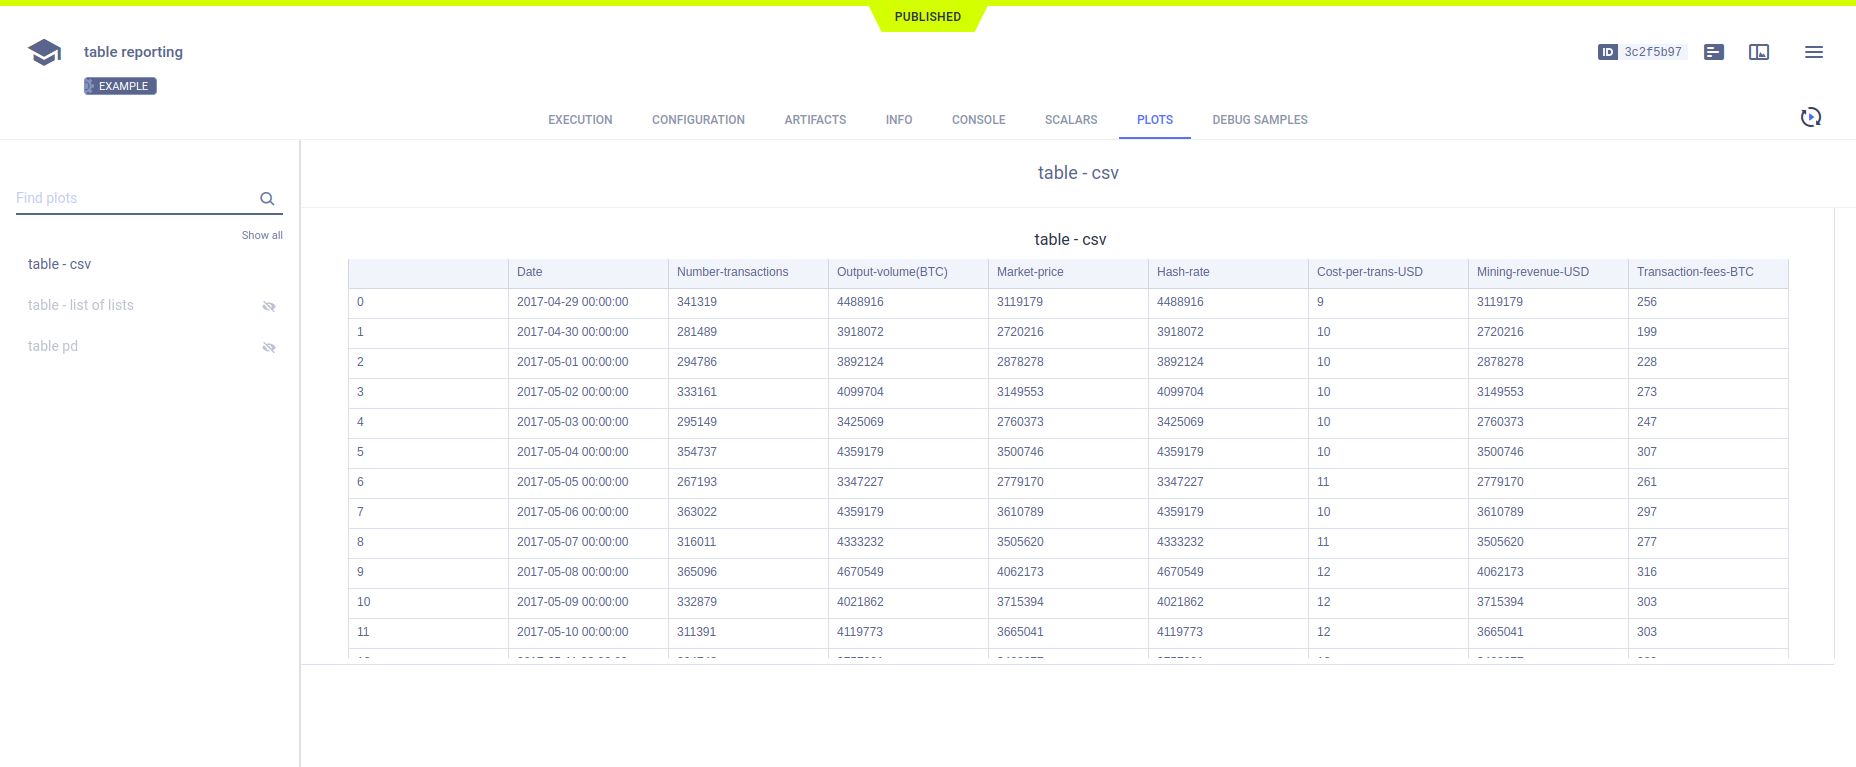
Reporting CSV Files as Tables
Report CSV files by providing the URL location of the CSV file in the url parameter. For a local CSV file, use the csv parameter.
# Report table - CSV from path
csv_url = "https://raw.githubusercontent.com/plotly/datasets/master/Mining-BTC-180.csv"
Logger.current_logger().report_table(
    "table csv",
    "remote csv",
    iteration=iteration,
    url=csv_url
)