Orchestration
With the Orchestration page, you can:
- Use Cloud autoscaling apps to define your compute resource budget, and have the apps automatically manage your resource consumption as needed–-with no code (available under the ClearML Pro plan)
- Monitor resources (CPU and GPU, memory, video memory, and network usage) used by the experiments / Tasks that workers execute
- View workers and the queues they listen to
- Manage worker queues
- Create and rename queues
- Delete empty queues
- Monitor queue utilization
- Reorder, move, and remove experiments from queues
- Monitor all of your available and in-use compute resources (available in the ClearML Enterprise plan. See Orchestration Dashboard)
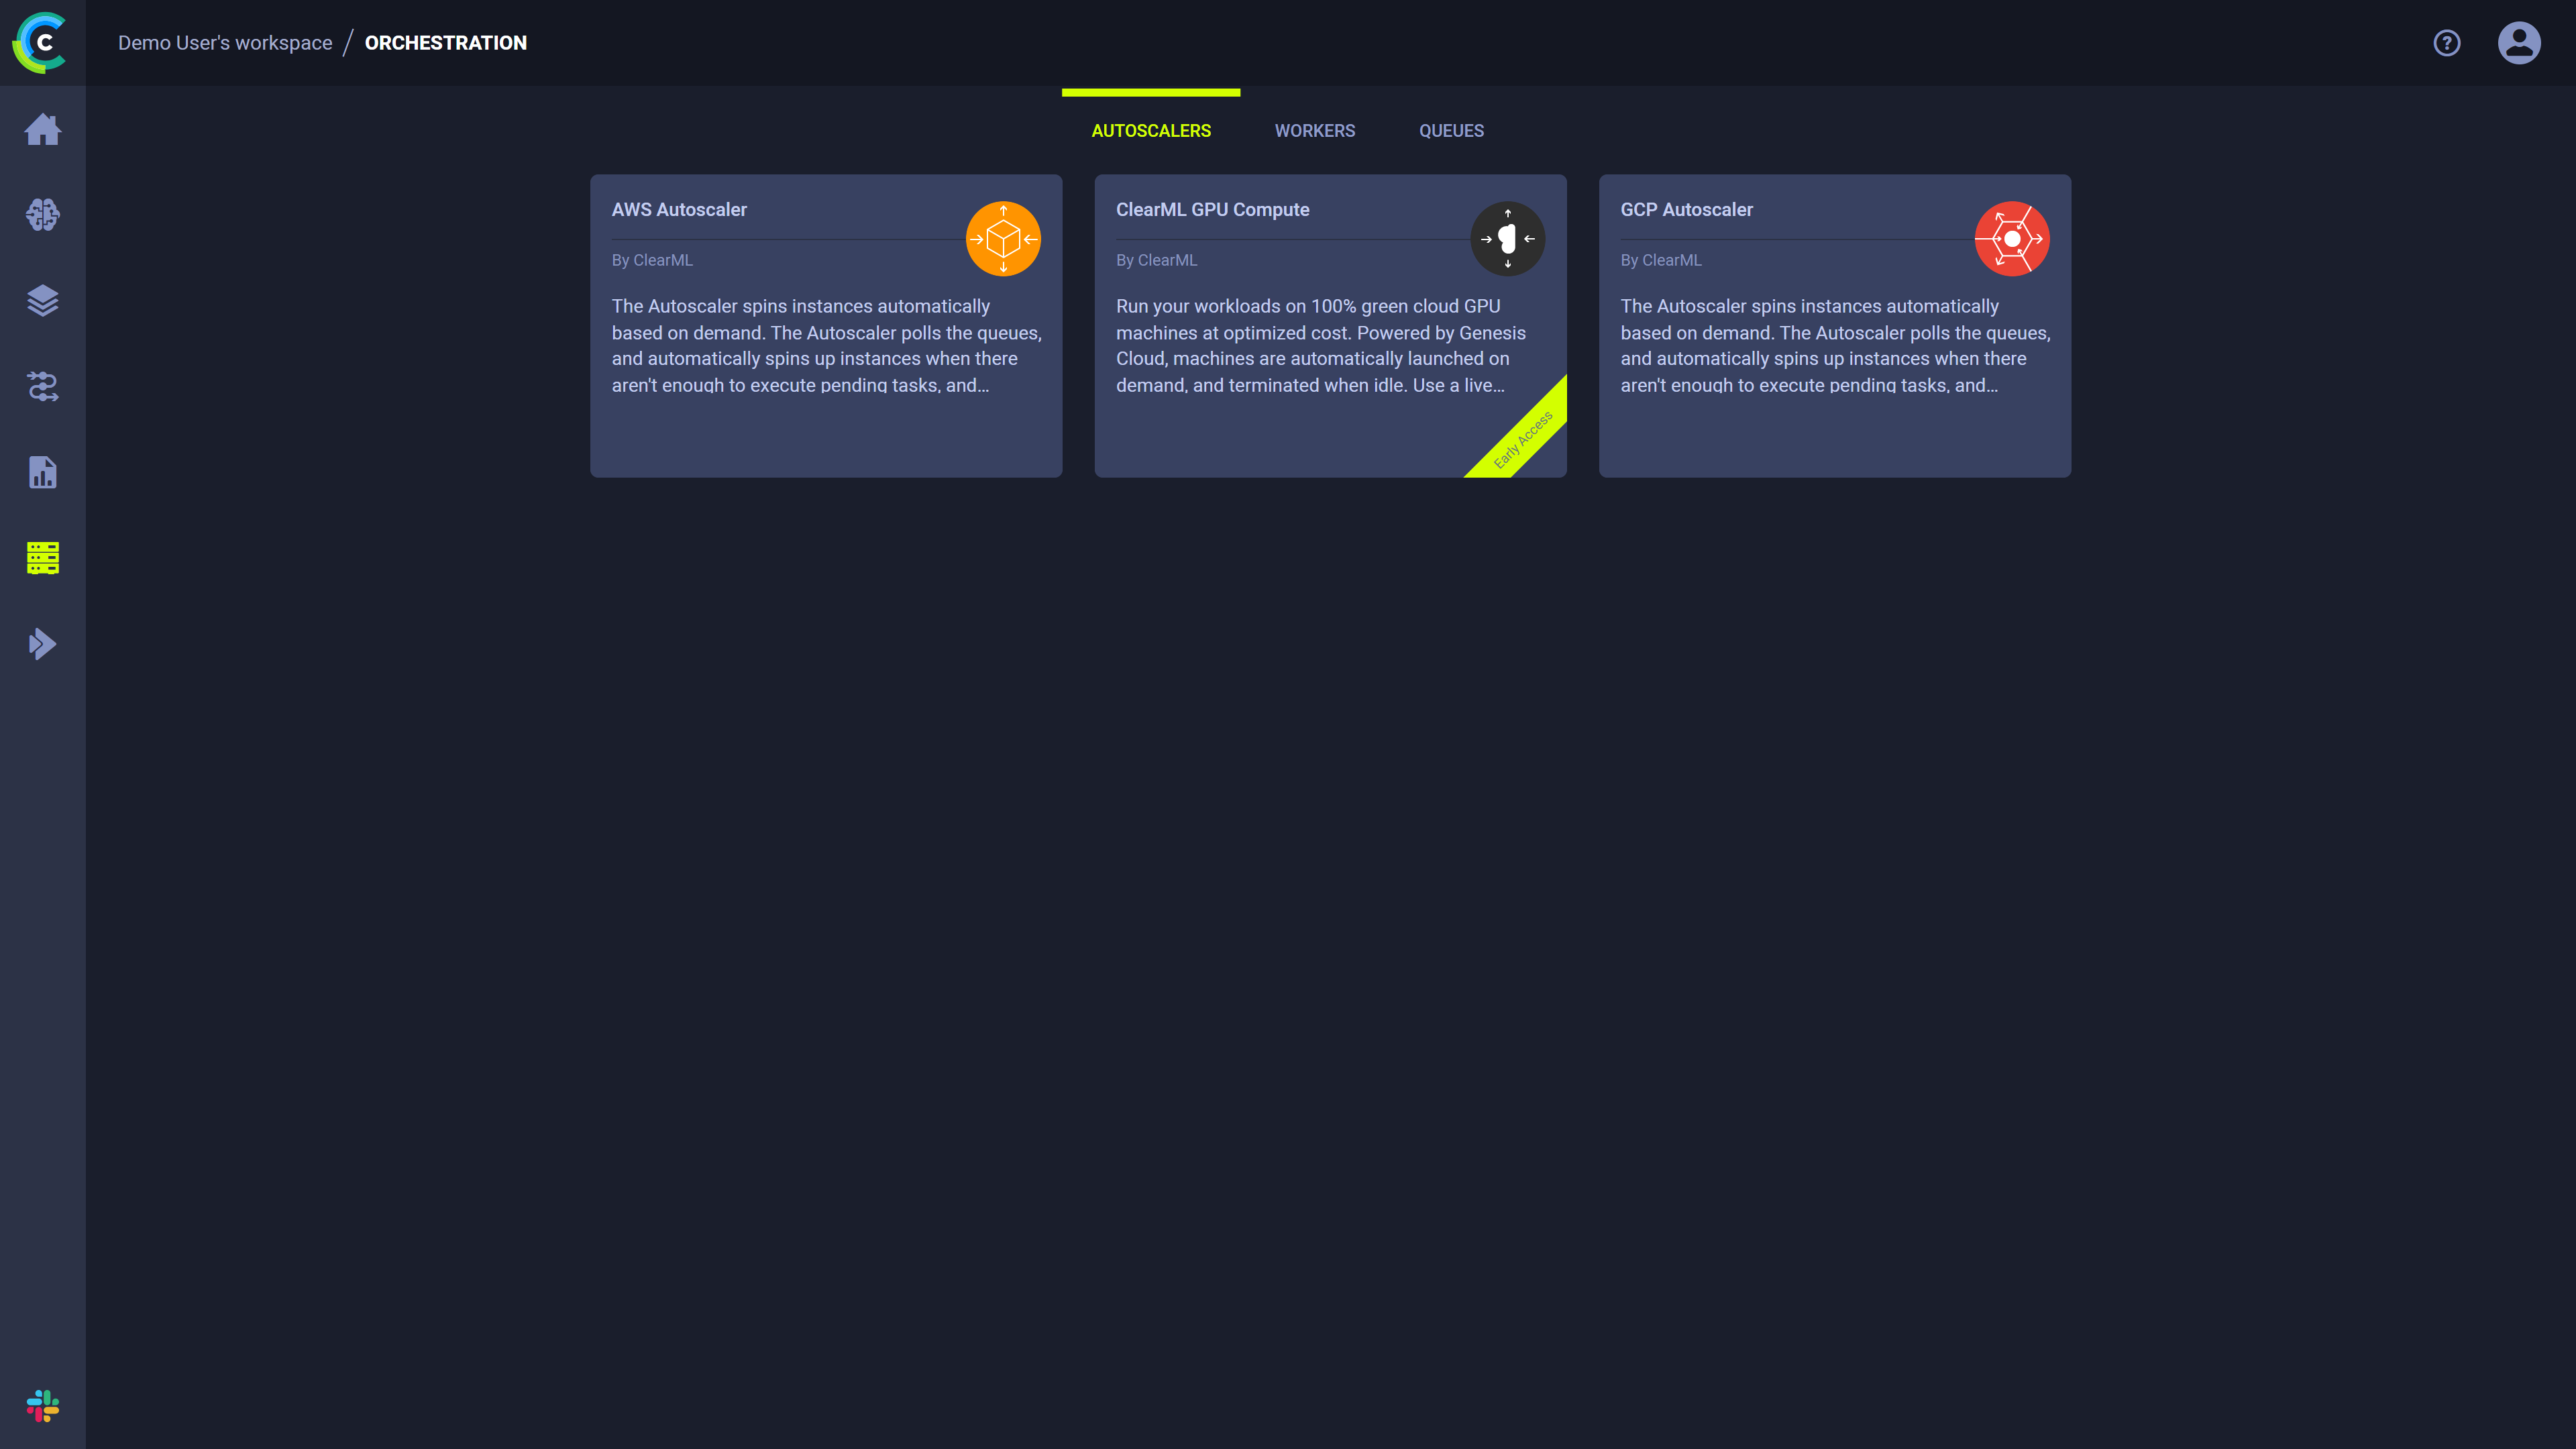
Autoscalers
The ClearML Autoscaler apps are available under the ClearML Pro plan
Use the AUTOSCALERS tab to access ClearML's cloud autoscaling applications:
- AWS Autoscaler
- GCP Autoscaler
The autoscalers automatically spin up or down cloud instances as needed and according to a budget that you set, so you pay only for the time that you actually use the machines.
The AWS and GCP autoscaler applications will manage instances on your behalf in your cloud account. When launching an app instance, you will provide your cloud service credentials so the autoscaler can access your account.
Once you launch an autoscaler app instance, you can monitor the autoscaler's activity and your cloud usage in the instance's dashboard.
For more information about how autoscalers work, see the Cloud Autoscaling Overview. For more information about a specific autoscaler, see AWS Autoscaler and/or GCP Autoscaler.
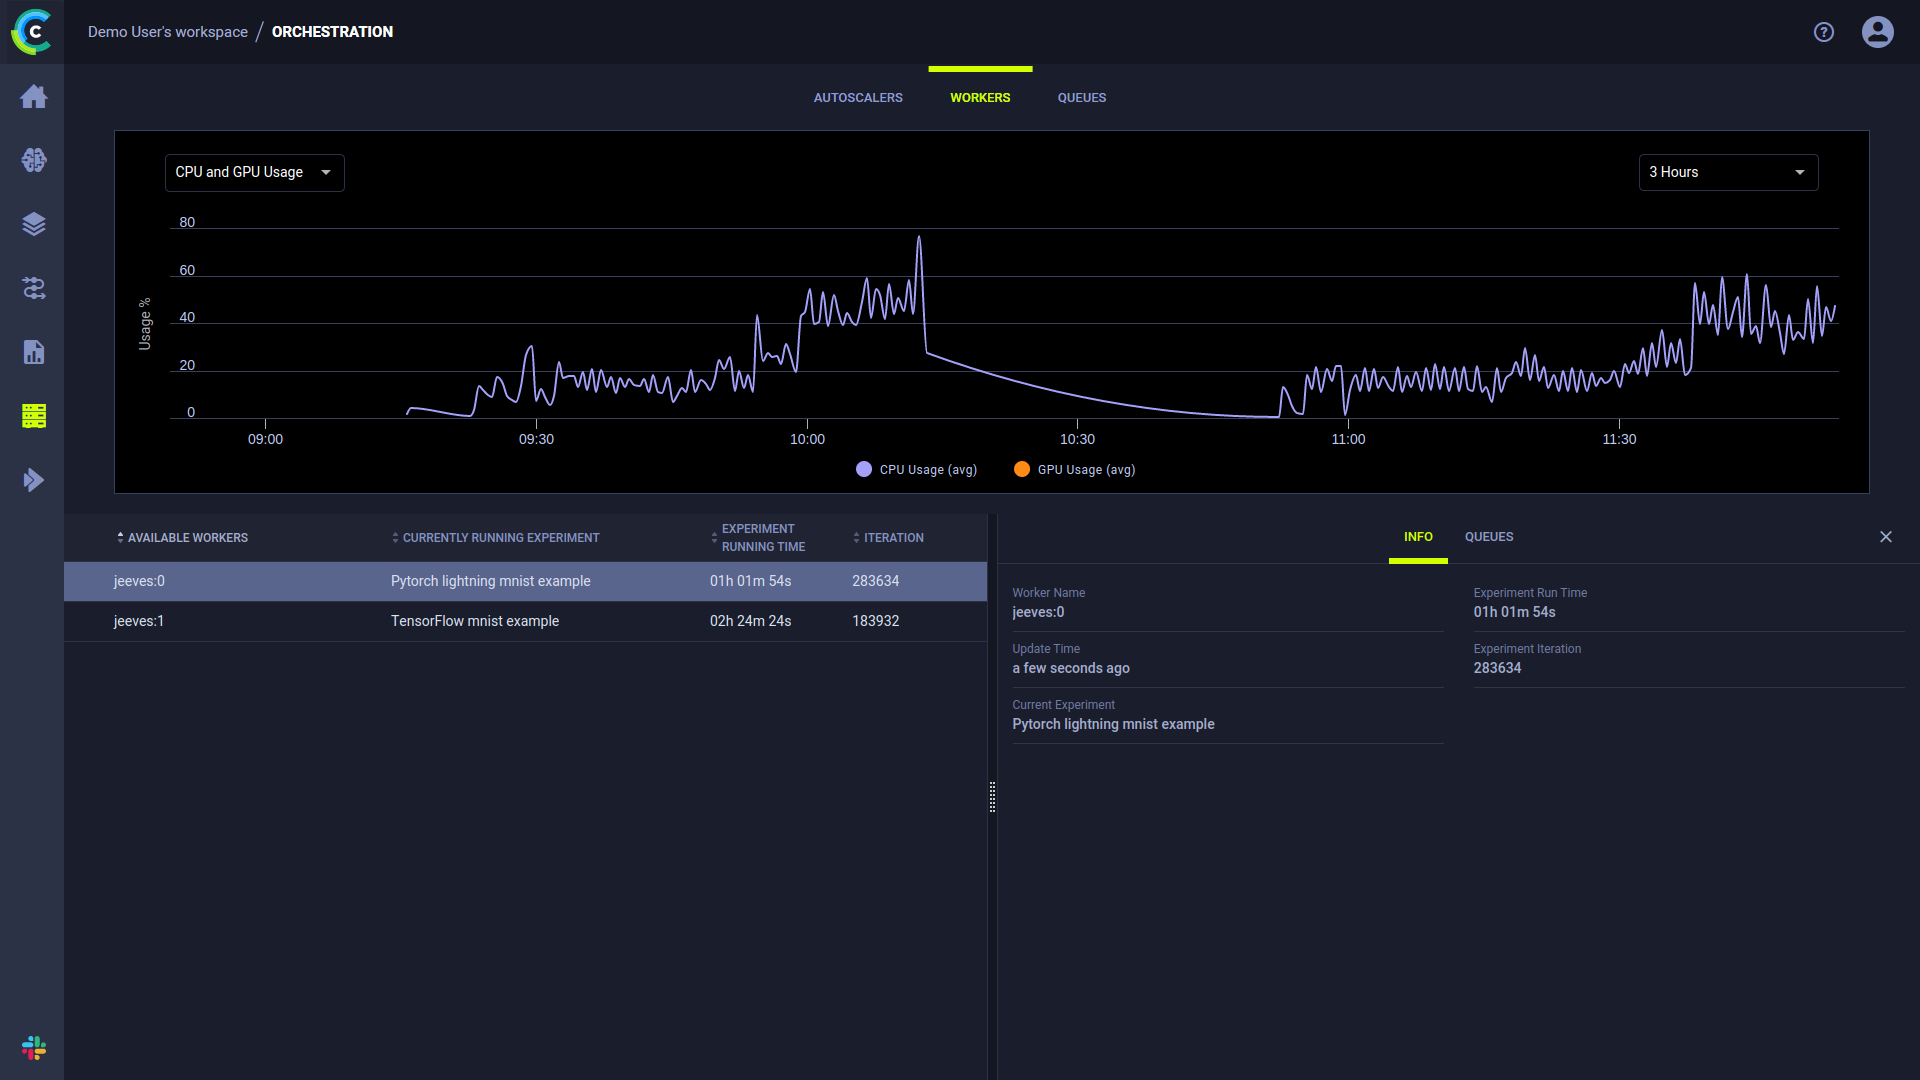
Workers
Use the WORKERS tab to track worker activity and monitor worker utilization. The page shows a worker activity graph and a worker details table. The graph time span can be controlled through the menu at its top right corner. Hover over any plot point to see its data. By default, the WORKER UTILIZATION graph displays the number of active and total workers over time.
The worker table shows the currently available workers and their current execution information:
- Current running experiment
- Current execution time
- Training iteration.
Clicking on a worker will open the worker's details panel and replace the graph with that worker's resource utilization information. The resource metric being monitored can be selected through the menu at the graph's top left corner:
- CPU and GPU Usage
- Memory Usage
- Video Memory Usage
- Network Usage.
The worker's details panel includes the following two tabs:
- INFO - worker information:
- Worker Name
- Update time - The last time the worker reported data
- Current Experiment - The experiment currently being executed by the worker
- Experiment Runtime - How long the currently executing experiment has been running
- Experiment iteration - The last reported training iteration for the experiment
- QUEUES - Information about the queues that the worker is assigned to:
- Queue - The name of the Queue
- Next experiment - The next experiment available in this queue
- In Queue - The number of experiments currently enqueued
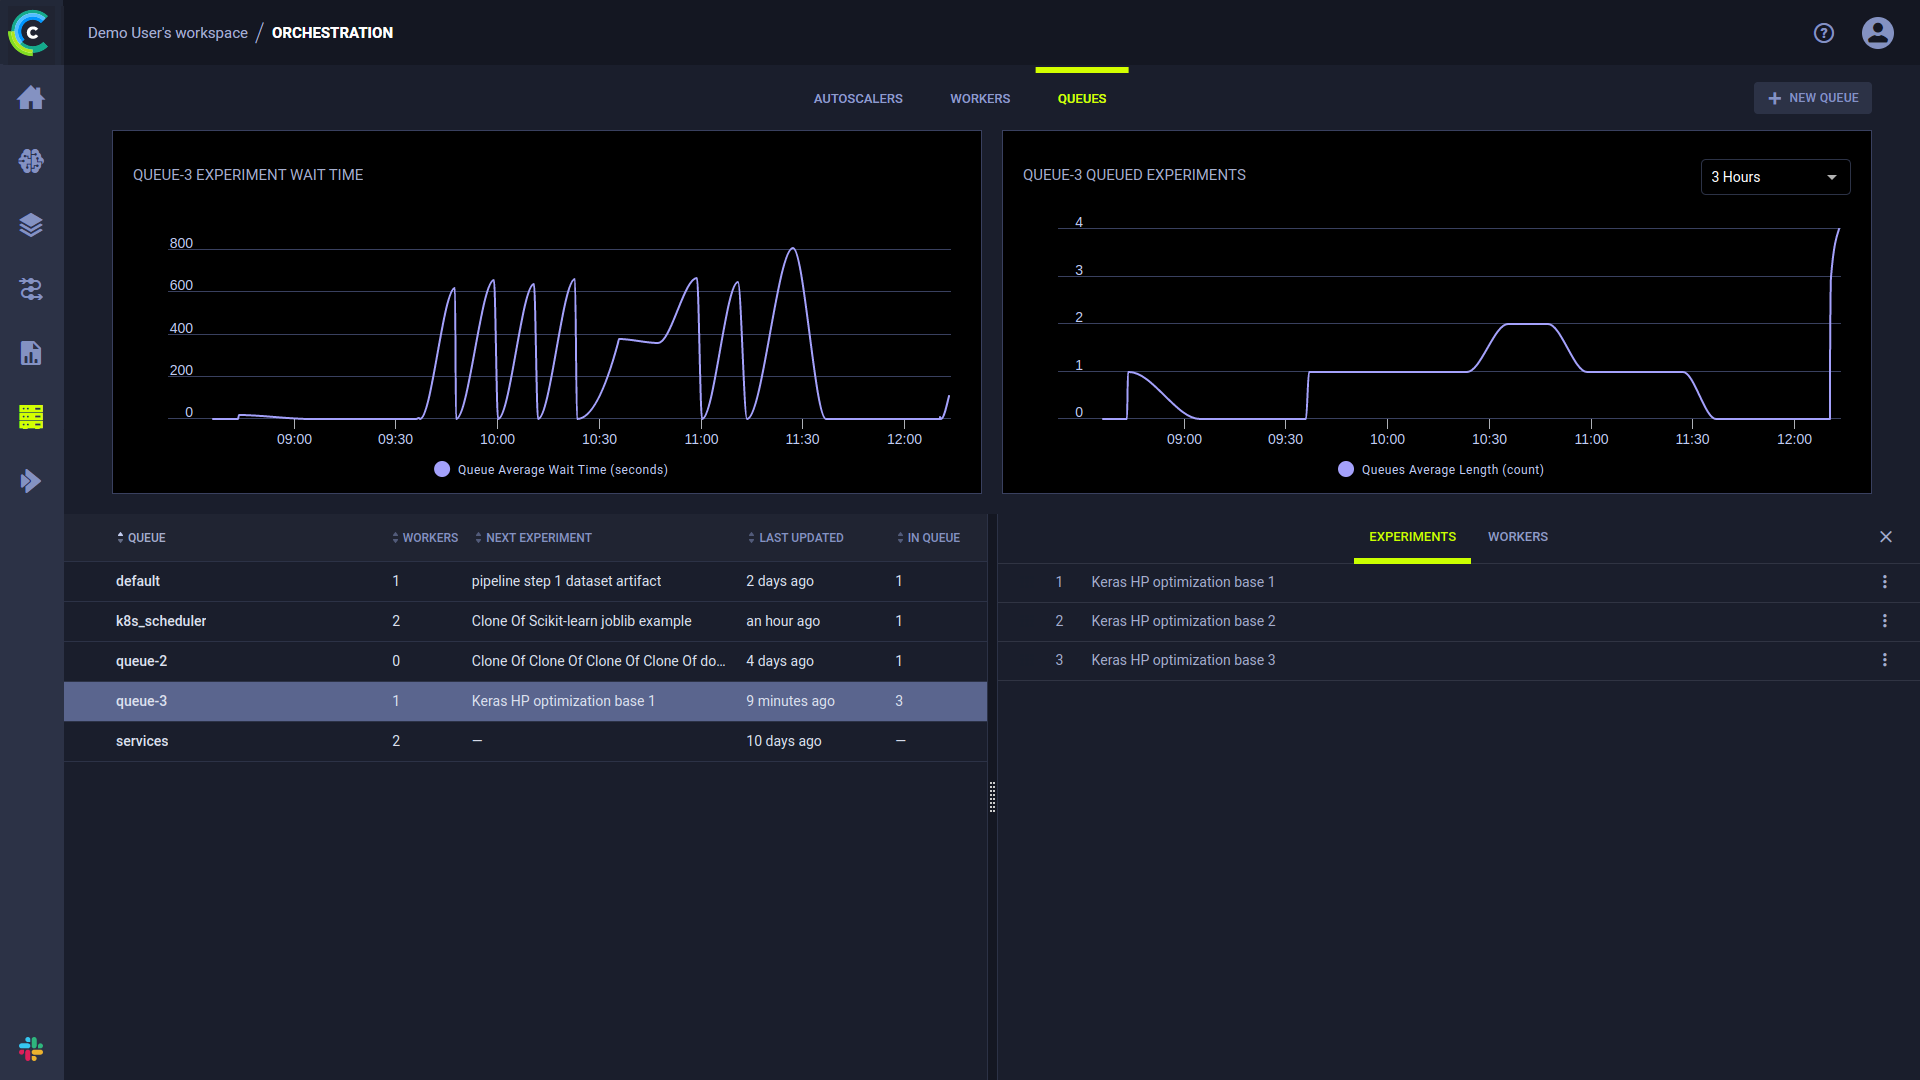
Queues
Use the QUEUES tab to manage queues and monitor their statistics. The page shows graphs of the average experiment wait time and the number of queued experiments, and a queue details table. Hover over any plot point to view its data. By default, the graphs display the overall information of all queues.
The queue table shows the following queue information:
- Queue - Queue name
- Workers - Number of workers servicing the queue
- Next Experiment - The next experiment available in this queue
- Last Updated - The last time queue contents were modified
- In Queue - Number of experiments currently enqueued in the queue
To create a new queue - Click + NEW QUEUE (top left).
Hover over a queue and click ![]() to copy the queue's ID.
to copy the queue's ID.
Right-click on a queue or hover and click its action button ![]() to access queue actions:
to access queue actions:
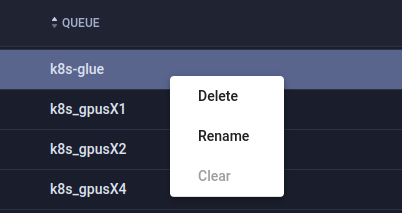
- Delete - Delete the queue. Any pending tasks will be dequeued.
- Rename - Change the queue's name
- Clear - Remove all pending tasks from the queue
- Custom action - The ClearML Enterprise Server provides a mechanism to define your own custom actions, which will appear in the context menu. See Custom UI Context Menu Actions
Clicking on a queue will open the queue's details panel and replace the graphs with that queue's statistics.
The queue's details panel includes the following two tabs:
- EXPERIMENTS - A list of experiments in the queue. You can reorder and remove enqueued experiments. See Controlling Queue Contents.
- WORKERS - Information about the workers assigned to the queue:
- Name - Worker name
- IP - Worker's IP
- Currently Executing - The experiment currently being executed by the worker
Controlling Queue Contents
Click on an experiment's menu button ![]() in the EXPERIMENTS tab to reorganize your queue:
in the EXPERIMENTS tab to reorganize your queue:

- Move a task to the top or bottom of the queue
- Move the task to a different queue
- Dequeue the task
You can also reorder experiments in a queue by dragging an experiment to a new position in the queue.