Reports
With ClearML's Reports you can write up notes, experiment findings, or really anything you want. You can create reports in any of your ClearML projects.
In addition to its main document, a report also contains a description field, which will appear in the report's card in the Reports Page. Reports are searchable based on their description, so adding a description can make it easier to find the report later.
Reports are editable Markdown documents, supporting:
- Multi-level headings
- Text formatting: Italics, bold, and strikethrough
- Bulleted and numbered lists
- Tables
- Code blocks
- Text and image hyperlinks
- Embedded images uploaded from your computer
- Embedded ClearML task, model, and app content

Publishing a report locks it for future editing, so you can preserve its contents. You can also share your reports, download a PDF copy, or simply copy the MarkDown content and reuse in your editor of choice.
Access ClearML reports through the Reports Page.
Embedding ClearML Visualizations
You can embed plots and images from your ClearML objects (experiments, models, and apps) into your reports: scalar graphs and other plots, and debug samples from an individual object or from an object comparison page. These visualizations are updated live as the object(s) updates.
To add a graphic resource:
Go to the resource you want to embed in your report (a plot or debug sample from an individual object or object comparison)
Hover over the resource and click
 .
. 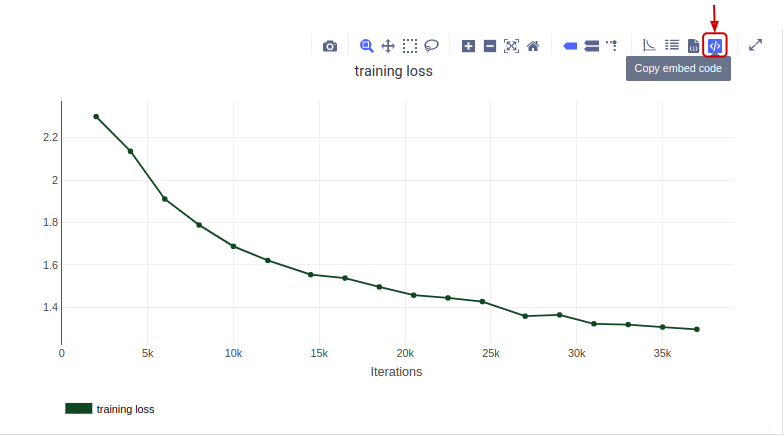
Click
Embed in ClearML report. This generates the embed code for accessing the resource, and copies it to your clipboard.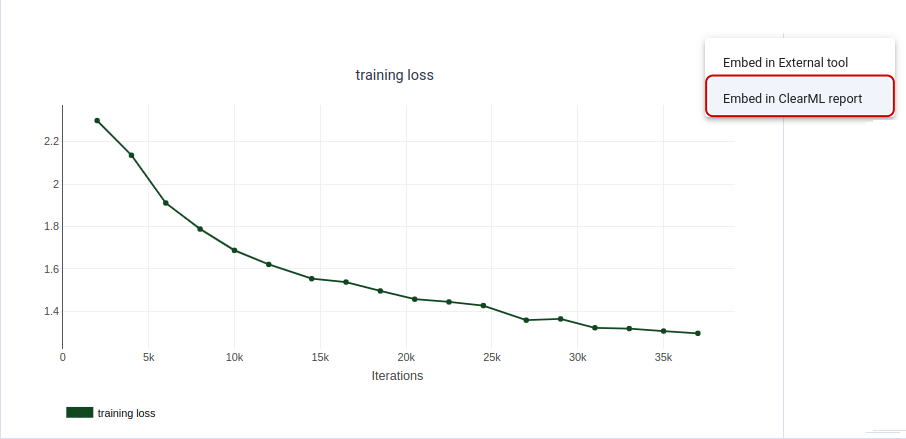
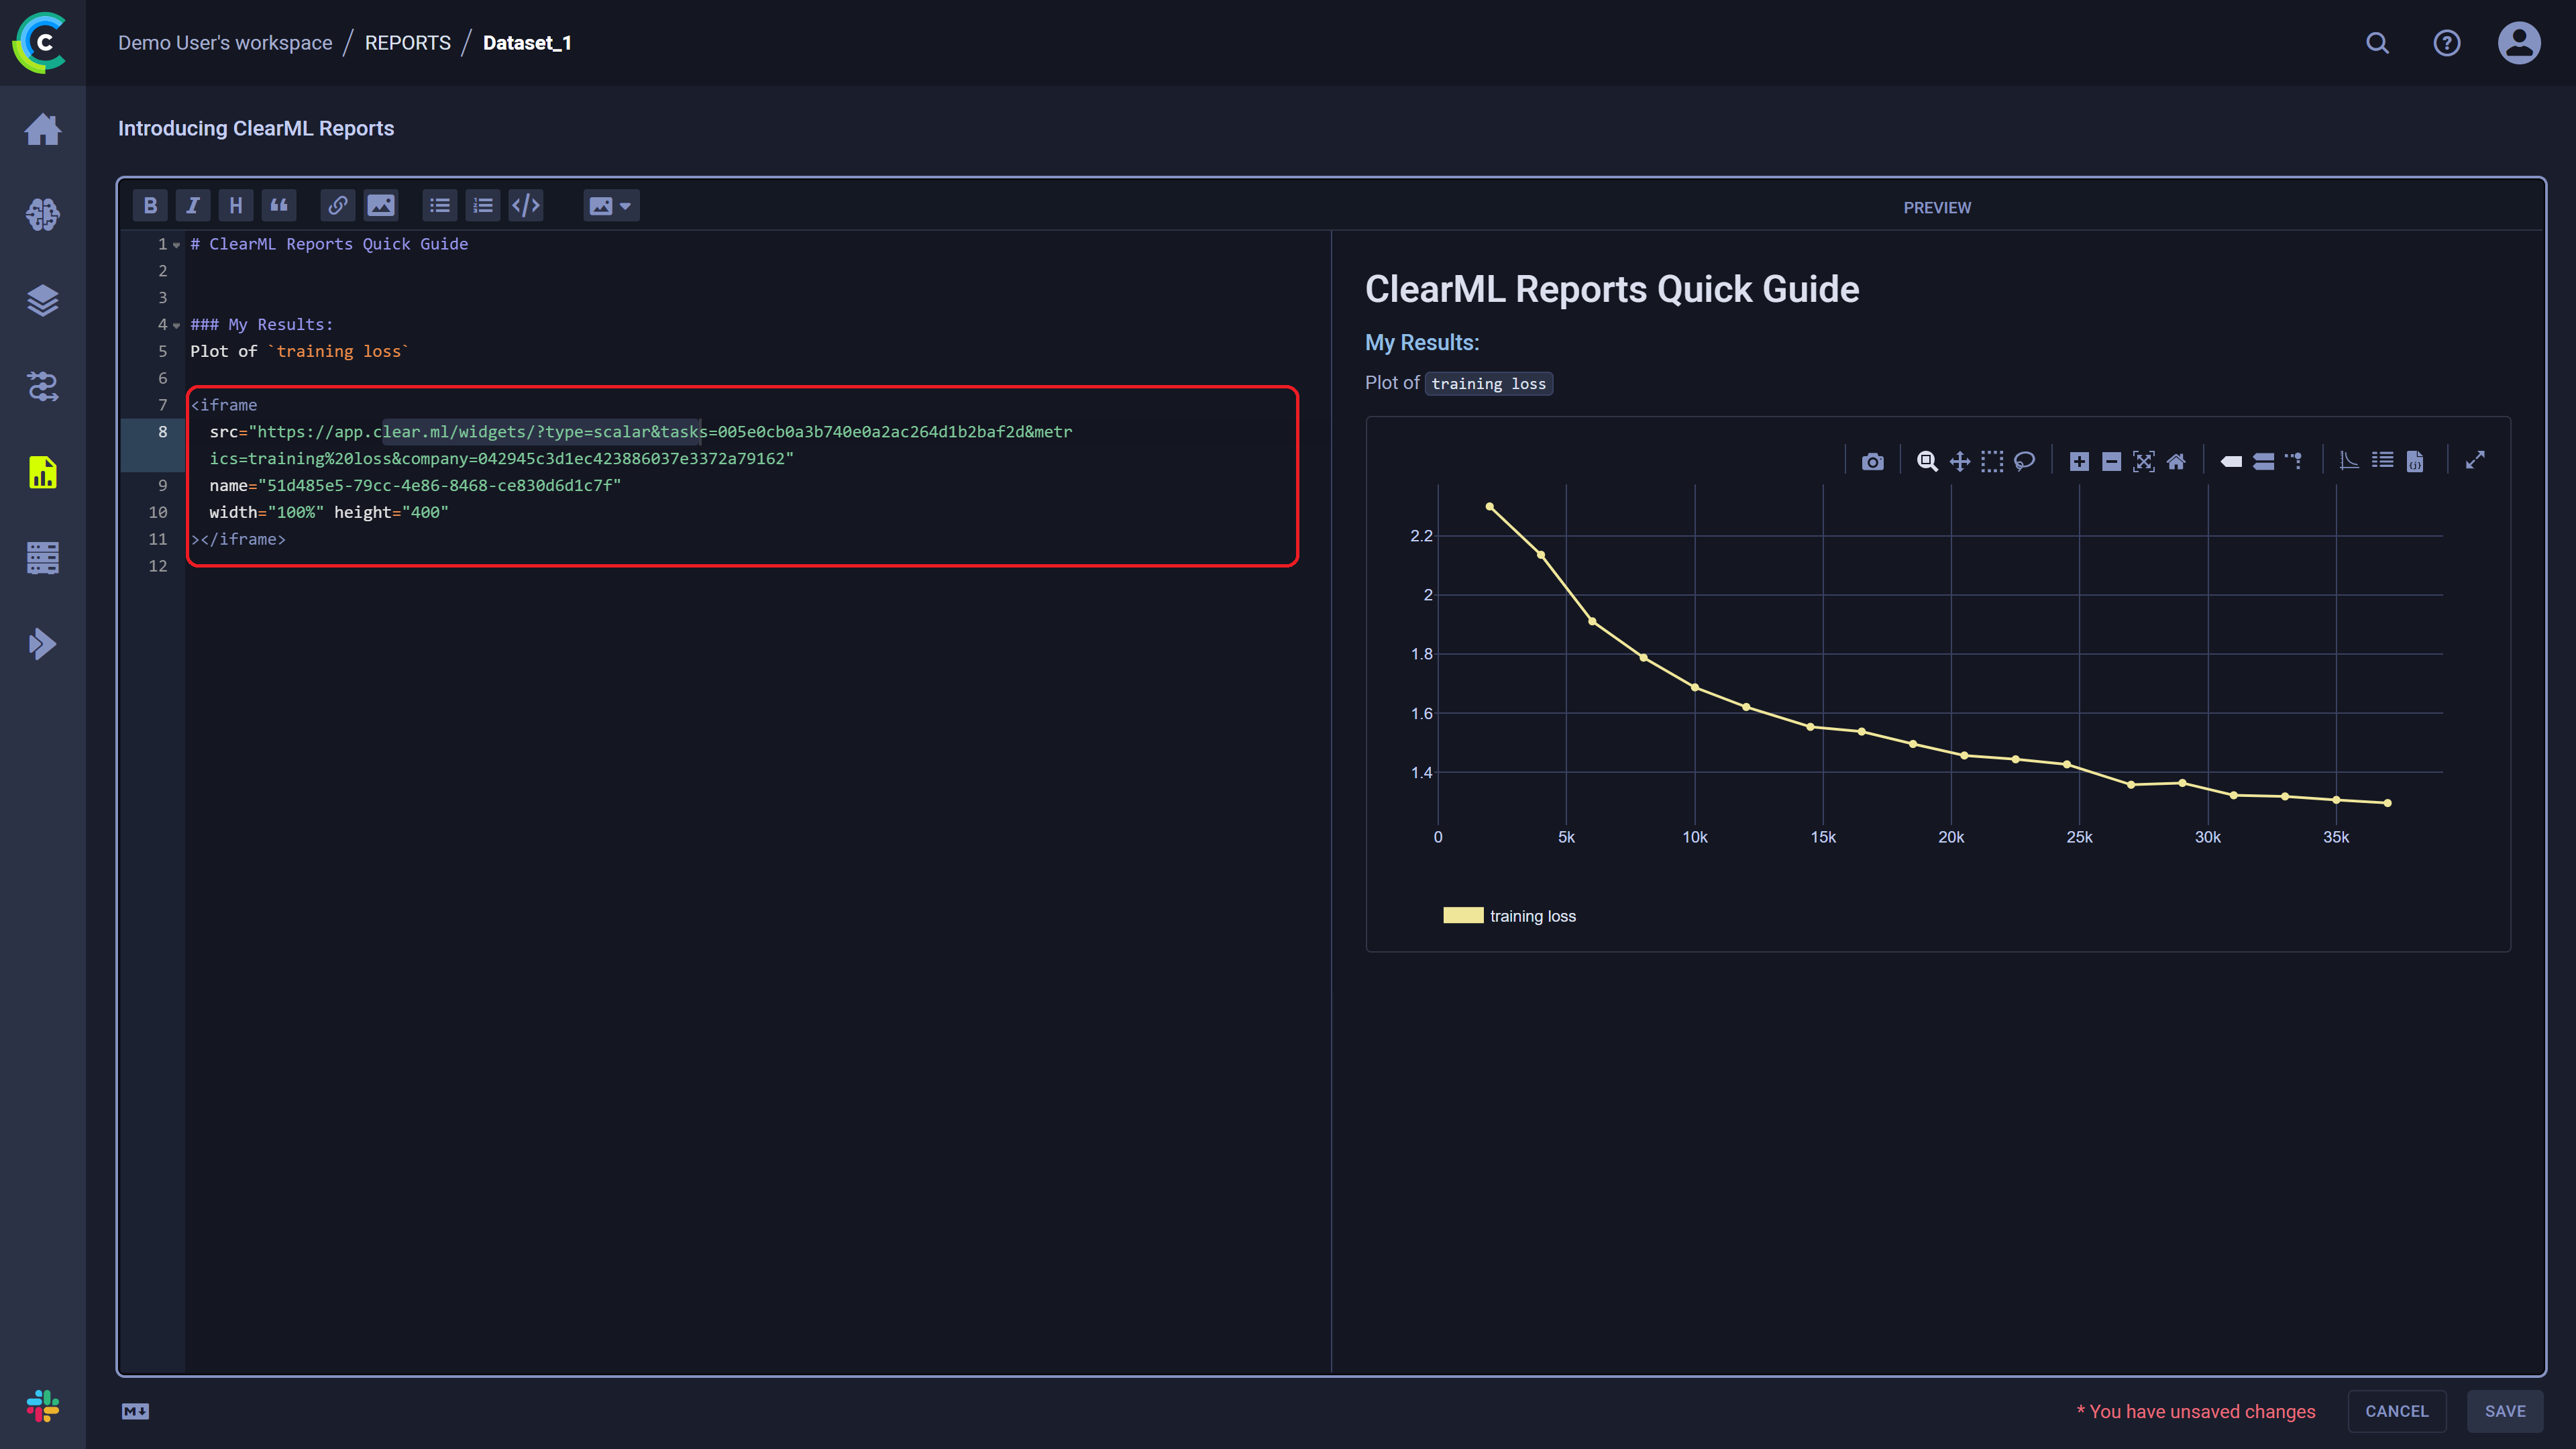
Return to your report page and paste the code snippet
Once embedded in the report, you can return to the resource's original location (e.g. comparison page, experiment/model/app page)
by clicking ![]() .
.
Customizing Embed Code
You can customize embed codes to make more elaborate queries for what you want to display in your reports. A standard embed code is formatted like this:
<iframe
  src="<web_server>/widgets/?type=sample&objectType=task&objects=<object_id>&xaxis=iter&metrics=<metric_name>&variants=Plot%20as%20an%20image&company=<company/workspace_id>"
  width="100%" height="400"
></iframe>
The src parameter is made up of the following components:
- Your web server's URL (e.g.
app.clear.ml) /widget/- The endpoint that serves the embedded data.- The query parameters for your visualization (the path and query are separated by a question mark
?)
The query is formatted like a standard query string: <parameter>=<parameter_value>. Multiple parameter-value pairs are
delimited with a &: <parameter_1>=<parameter_value_1>&<parameter_2>=<parameter_value_2>.
The query string usually includes the following parameters:
objectType- The type of object to fetch. The options aretaskormodel(taskalso includes ClearML app instances).objects- Object IDs (i.e. task or model IDs depending on specified ObjectType). Specify multiple IDs like this:objects=<id>&objects=<id>&objects=<id>. Alternatively, you can input a query, and the matching objects' specified resources will be displayed. See Dynamic Queries below.type- The type of resource to fetch. The options are:plotscalarsingle(single-scalar values table)sample(debug sample)parcoords(hyperparameter comparison plots) - for this option, you need to also specify the following parameters:metrics- Unique metric/variant ID formatted likemetric_id.variant_id(see note below)variants- Parameters to include in the plot (write in following format<section_name>.<parameter_1>&<section_name>.<parameter_2>)value_type- Specify which metric values to use. The options are:min_valuemax_valuevalue(last value)
xaxis- Set the x-axis units for plots. The options are:iter- Iteration (default)timestamp- Time from startiso_time- Wall time
metrics- Metric namevariants- Variant's namecompany- Workspace ID. Applicable to the ClearML hosted service, for embedding content from a different workspacelight- add parameter to switch visualization to light theme
For strings, make sure to use the appropriate URL encoding. For example, if the metric name is "Metric Name",
write Metric%20Name
Dynamic Queries
You can create more complex queries by specifying object criteria (e.g. tags, statuses, projects, etc.) instead of
specific task IDs, with parameters from the tasks.get_all or
models.get_all API calls.
For these parameters, use the following syntax:
key=valuefor non-array fieldskey[]=<value1>,<value2>for array fields.
Delimit the fields with &s.
Examples:
The following are examples of dynamic queries. All the examples use objectType=task, but objectType=model can also be
used.
Request the scalars plot of a specific metric variant for the latest experiment in a project:
src="<web_server>/widgets/?objectType=task&xaxis=iter&type=scalar&metrics=<metric_name>&variants=<variant>&project=<project_id>&page_size=1&page=0&order_by[]=-last_updateNotice that the
projectparameter is specified. To get the most recent single experiment,page_size=1&page=0&order_by[]=-last_updateis added.page_sizespecifies how many results are returned in each page, andpagespecifies which page to return (in this case the first page)--this way you can specify how many experiments you want in your graph.order_by[]=-last_updateorders the results by update time in descending order (most recent first).Request the scalars plot of a specific metric variant for the experiments with a specific tag:
src="<web_server>/widgets/?objectType=task&xaxis=iter&type=scalar&metrics=<metric_name>&variants=<variant>&tags[]=__$or,<tag>A list of tags that the experiment should contain is specified in the
tagsargument. You can also specify tags that exclude experiments. See tag filter syntax examples here.Request the
training/accuracyscalar plot of the 5 experiments with the best accuracy scores (see Metric/Variant IDs note below):src="<web_server>/widgets/?objectType=task&xaxis=iter&type=scalar&metrics=training&variants=accuracy&project=4043a1657f374e9298649c6ba72ad233&page_size=5&page=0&order_by[]=-last_metrics.<metric_id>.<variant_id>.value"
Metric names need to be MD5 encoded for parallel coordinate plots and for ordering query results by metric
performance. You can encode the strings in Python with hashlib.md5(str("<metric_string>").encode("utf-8")).hexdigest(),
and use the returned MD5 hash in your query.
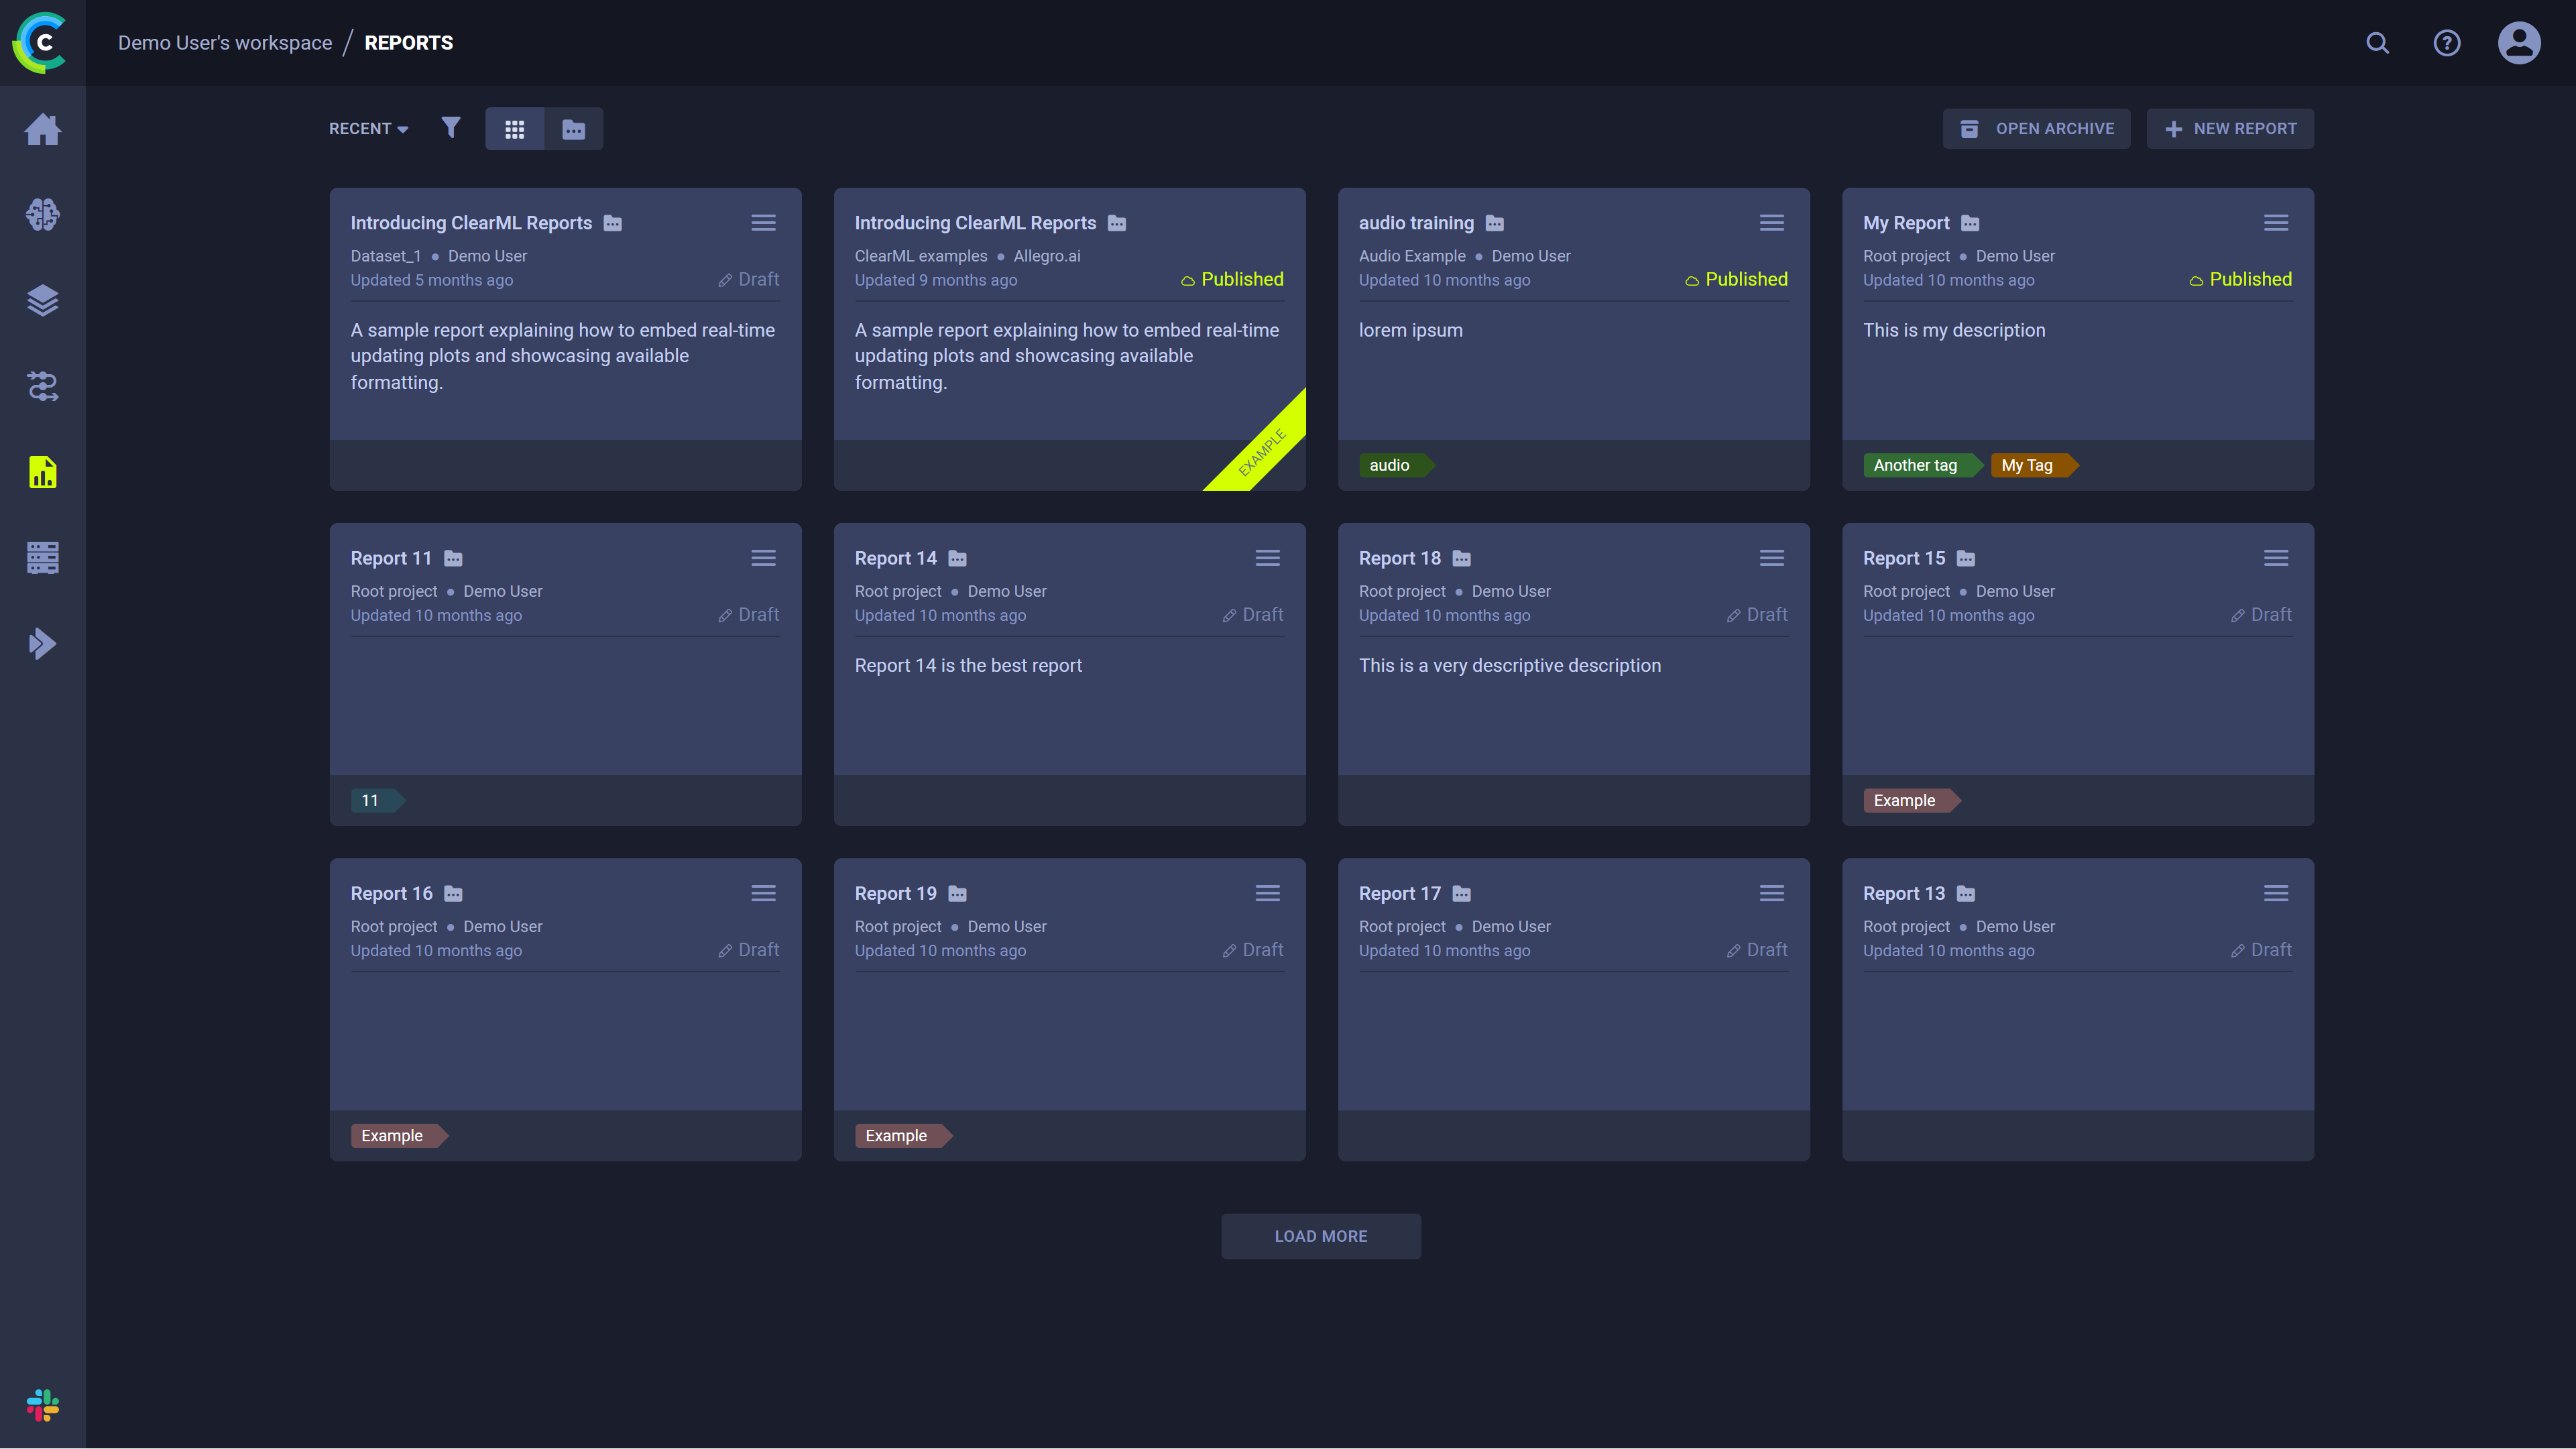
Reports Page
Use the Reports Page to navigate between and manage reports.
You can view the reports page in Project view ![]() or in List view
or in List view ![]() . In List
view, all reports are shown side-by-side. In Project view, reports are organized according to their projects, and
top-level projects are displayed. Click on a project card to view the project's reports.
. In List
view, all reports are shown side-by-side. In Project view, reports are organized according to their projects, and
top-level projects are displayed. Click on a project card to view the project's reports.
Project Cards
In Project view, project cards display a project's summarized report information:
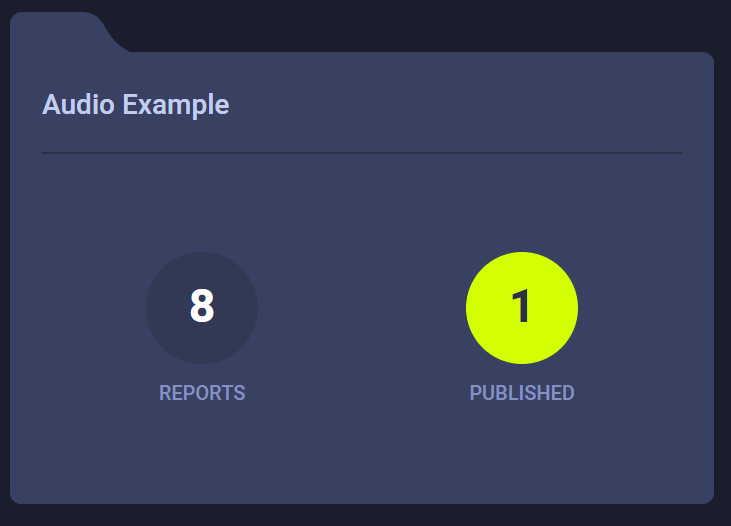
Click on a project card to view its reports.
Report Cards
In List view, the report cards display summarized report information:
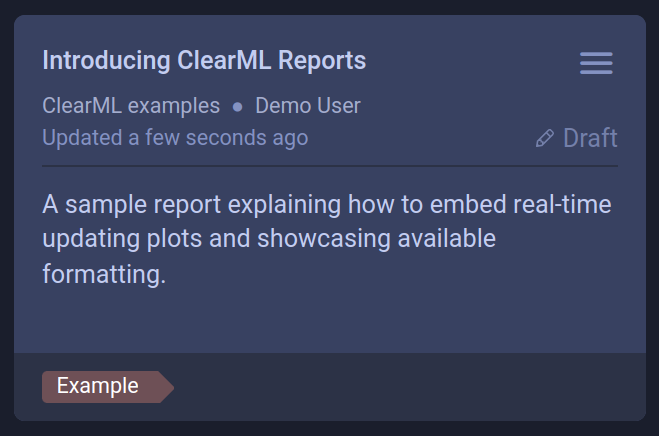
- Report name
- Report's project
- Creating user
- Last update time
- Status
- Description
- Tags
Report Actions
Click ![]() on the top right
of a report card to open its context menu and access report actions:
on the top right
of a report card to open its context menu and access report actions:
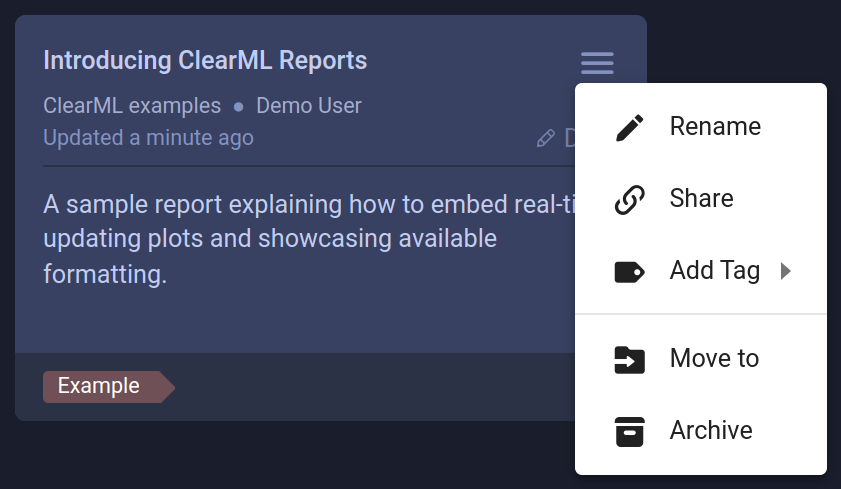
- Rename - Change the report's name
- Share - Copy URL to share report
- Add Tag - Add labels to the report to help easily classify groups of reports.
- Move to - Move the report into another project. If the target project does not exist, it is created on-the-fly.
- Archive - Move report from active reports page to archive
- Delete - Delete the report. To delete a report, it must first be archived.
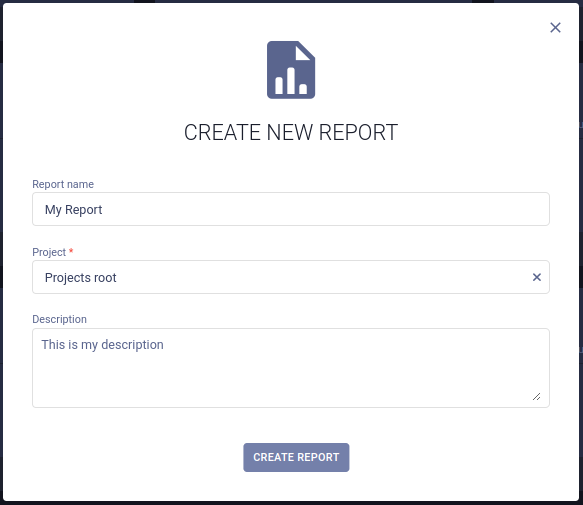
Create Reports
To create a report, click the + NEW REPORT button in the top right of the page, which will open a New Report modal.
MarkDown Formatting Quick Guide
The following is a quick reference for the MarkDown syntax that can be used in ClearML Reports.
Heading Levels
To create headings, add # in front of the phrases that you want to turn into
headings. The number of # signs correspond to the heading level (i.e. # for level-1 heading, ## for level-2, etc.):
| MarkDown | Rendered Output |
|---|---|
# H1## H2### H3#### H4##### H5###### H6 |  |
Text Emphasis
The following table presents the text format options:
| Format Option | MarkDown | Rendered Output |
|---|---|---|
| Bold | **This is bold text** and __so is this__ | This is bold text and so is this |
| Italics | *This is italic text* and _so is this_ | This is italic text and so is this |
| Strikethrough | ~~Strikethrough~~ | |
| Inline Code | `this is code` | this is code |
Blockquotes
To create a blockquote, add a > before each line of the quote. Nest blockquotes by adding additional
> signs before each line of the nested blockquote.
| MarkDown | Rendered Output |
|---|---|
> Blockquote |  |
Lists
Ordered List
Create an ordered list by numbering the list items with numbers followed by periods. The list items do not have to be numbered
correctly, but the list will be rendered numerically starting with 1..
| MarkDown | Rendered Output |
|---|---|
1. Item 1 |  |
Unordered List
Create an unordered list by starting each line with the +, -, or * signs. Different
signs can be used to create the bullets in the same list, but they are all rendered uniformly.
You can also use checkmarks (* [x]), following any of the bullet signs.
To nest lists, indent nested items 2 spaces more than their parent list item.
| MarkDown | Rendered Output |
|---|---|
+ Item 1 |  |
Tables
MarkDown code for a table looks like this:
|          | Align Right | Align Left | Align Center |
| -------- | -----------:|:---------- |:------------:|
| 1        |           1 | 1          |      1       |
| 11       |          11 | 11         |      11      |
The rendered output should look like this:
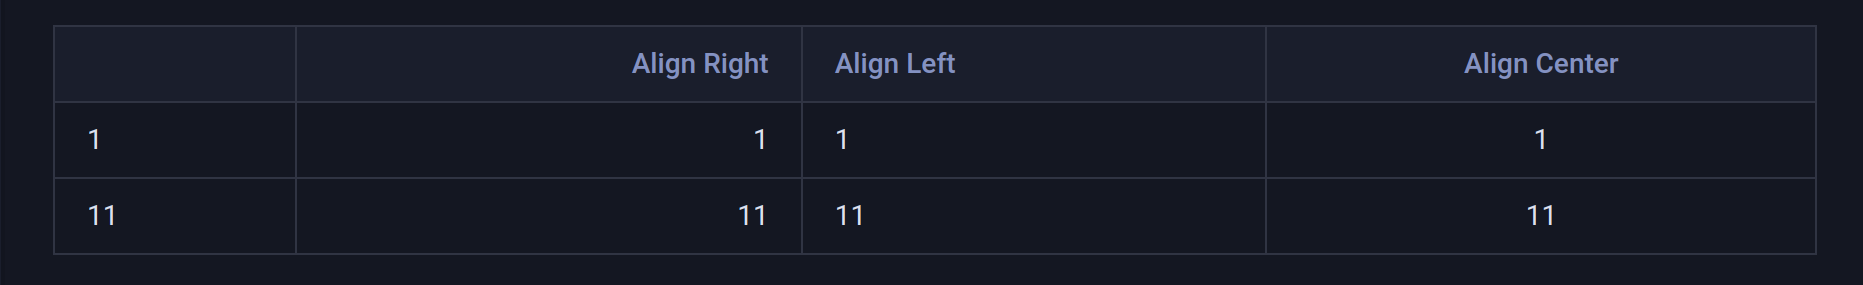
Add the table column names in the first row; each name is preceded and followed by a pipe (|).
In the second row, add sets of at least three hyphens (---) for each column, and add a pipe before and after each set
of hyphens. In the second row, you can specify each table column's contents alignment. To align the contents to the
left, place a colon (:) to the left of the hyphens. To align right, place a colon to the right of the hyphens. To
center align, place colons on both sides of the hyphens.
Code
To render inline code, surround the code with single backticks (`). For example `code` will be rendered code.
To create block code, use one of the following options:
Indent the code
    from clearml import Task

    t = Task.init(project_name='My project', task_name='Base')
Surround code with "fences"--three backticks (
```):```
from clearml import Task

t = Task.init(project_name='My project', task_name='Base')
```
Both of these options will be rendered as:
from clearml import Task
t = Task.init(project_name='My project', task_name='Base')
Syntax Highlighting
To display syntax highlighting, specify the coding language after the first fence (e.g. ```python, ```json, ```js, etc.):
```python
from clearml import Task

t = Task.init(project_name='My project', task_name='Base')
```
The rendered output should look like this:
from clearml import Task

t = Task.init(project_name='My project', task_name='Base')
Links
To create a link, enclose link text inside brackets, followed by the URL link enclosed in parentheses:
[link text](https://clear.ml)
The rendered output should look like this: link text
To add a title to the link, which you can see in a tooltip when hovering over the link, add the title after the URL link in the parentheses:
[link with title](https://clear.ml "ClearML Documentation")
The rendered output should look like this: link with title. Hover over the link to see the link's title.
Collapsible Sections
The MarkDown code for a collapsible panel looks like this:
| MarkDown | Rendered Output |
|---|---|
<details> | Section titleCollapsible Section Contents |
The collapsible panel is surrounded by <details> tags. Within the <details> tag, add the section's title between
the <summary> tags. This title can be seen when the panel is collapsed. After the </summary> tag, add the panel
contents.
Horizontal Rules
Create horizontal lines using three hyphens (---), underscores (___), or asterisks (***):
| MarkDown | Rendered Output |
|---|---|
--- |  |
Images
To add an image, add an exclamation point, followed by the alt text enclosed by brackets, followed by the link to the image enclosed in parentheses:

The rendered output should look like this:
![]()
To add a title to the image, which you can see in a tooltip when hovering over the image, add the title after the image's link:

The rendered output should look like this:
Hover over the image to see its title.