Model Details
In the models table, double-click on a model to view and/or modify the following:
- General model information
- Model configuration
- Model label enumeration
- Model metadata
- Model scalars and other plots
Models in Draft status are editable, so you can modify their configuration, label enumeration, and metadata. Published models are read-only, so only their metadata can be modified.
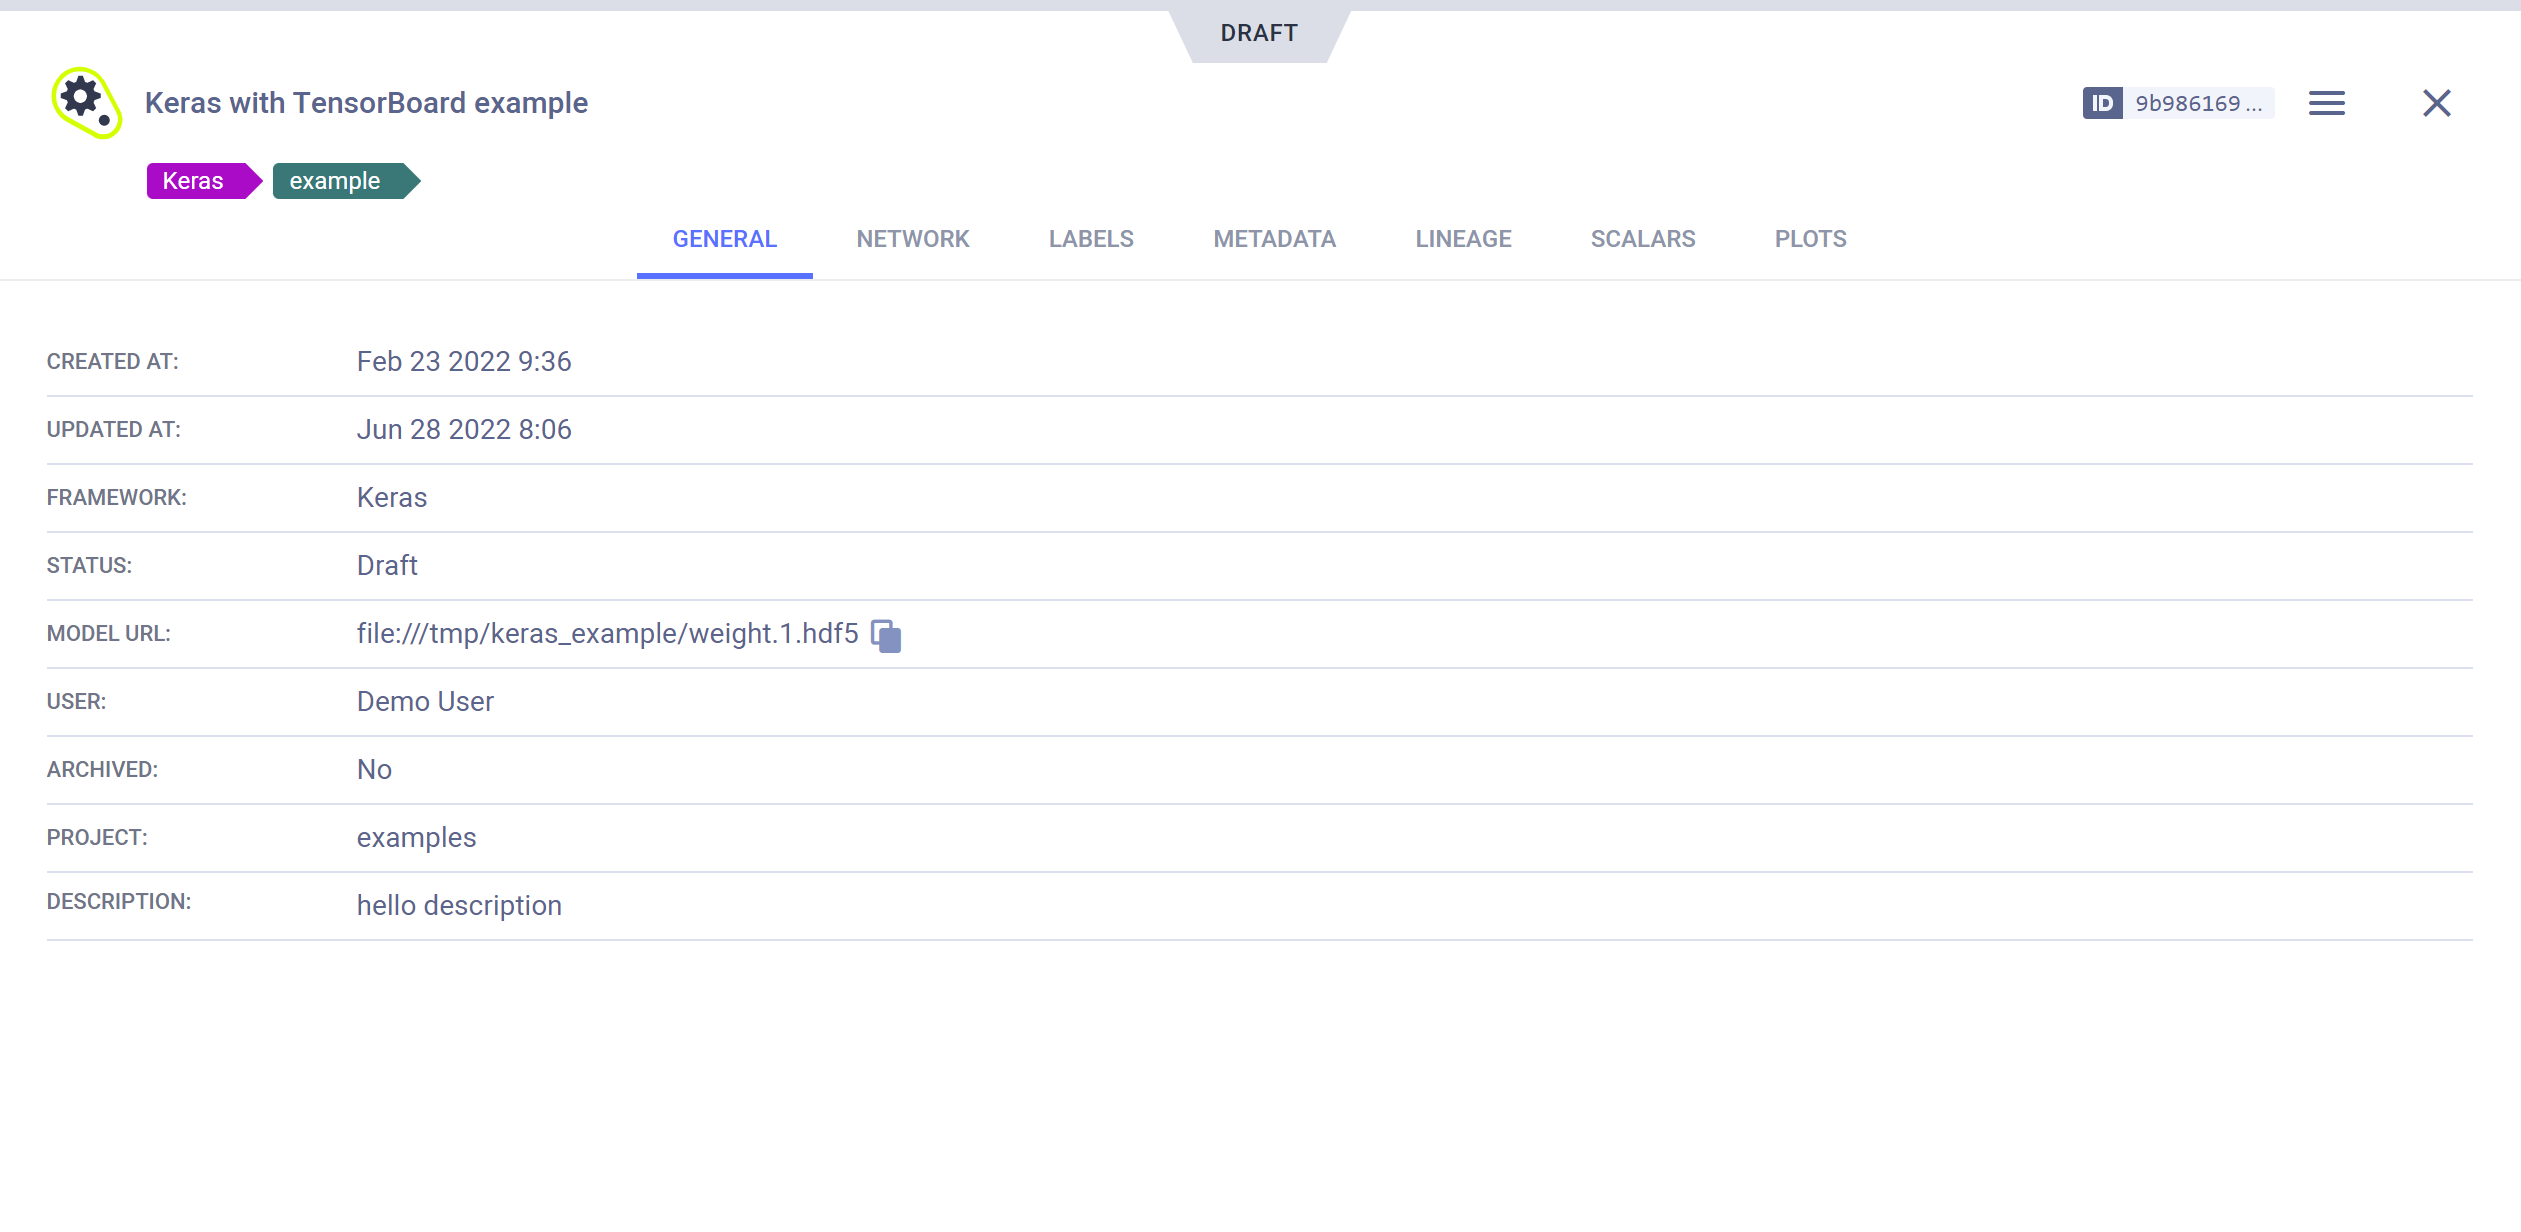
General Model Information
The GENERAL tab lists the model's General information including:
- Model URL
- ML Framework
- Creating experiment (ClearML experiment that generated the model)
- Description (click to edit)
If the model is stored in a network location, it can be downloaded by clicking the model URL. If the model was stored on the local machine you can copy its URL to manually access it.
Model Configuration
The NETWORK tab displays the model's configuration.
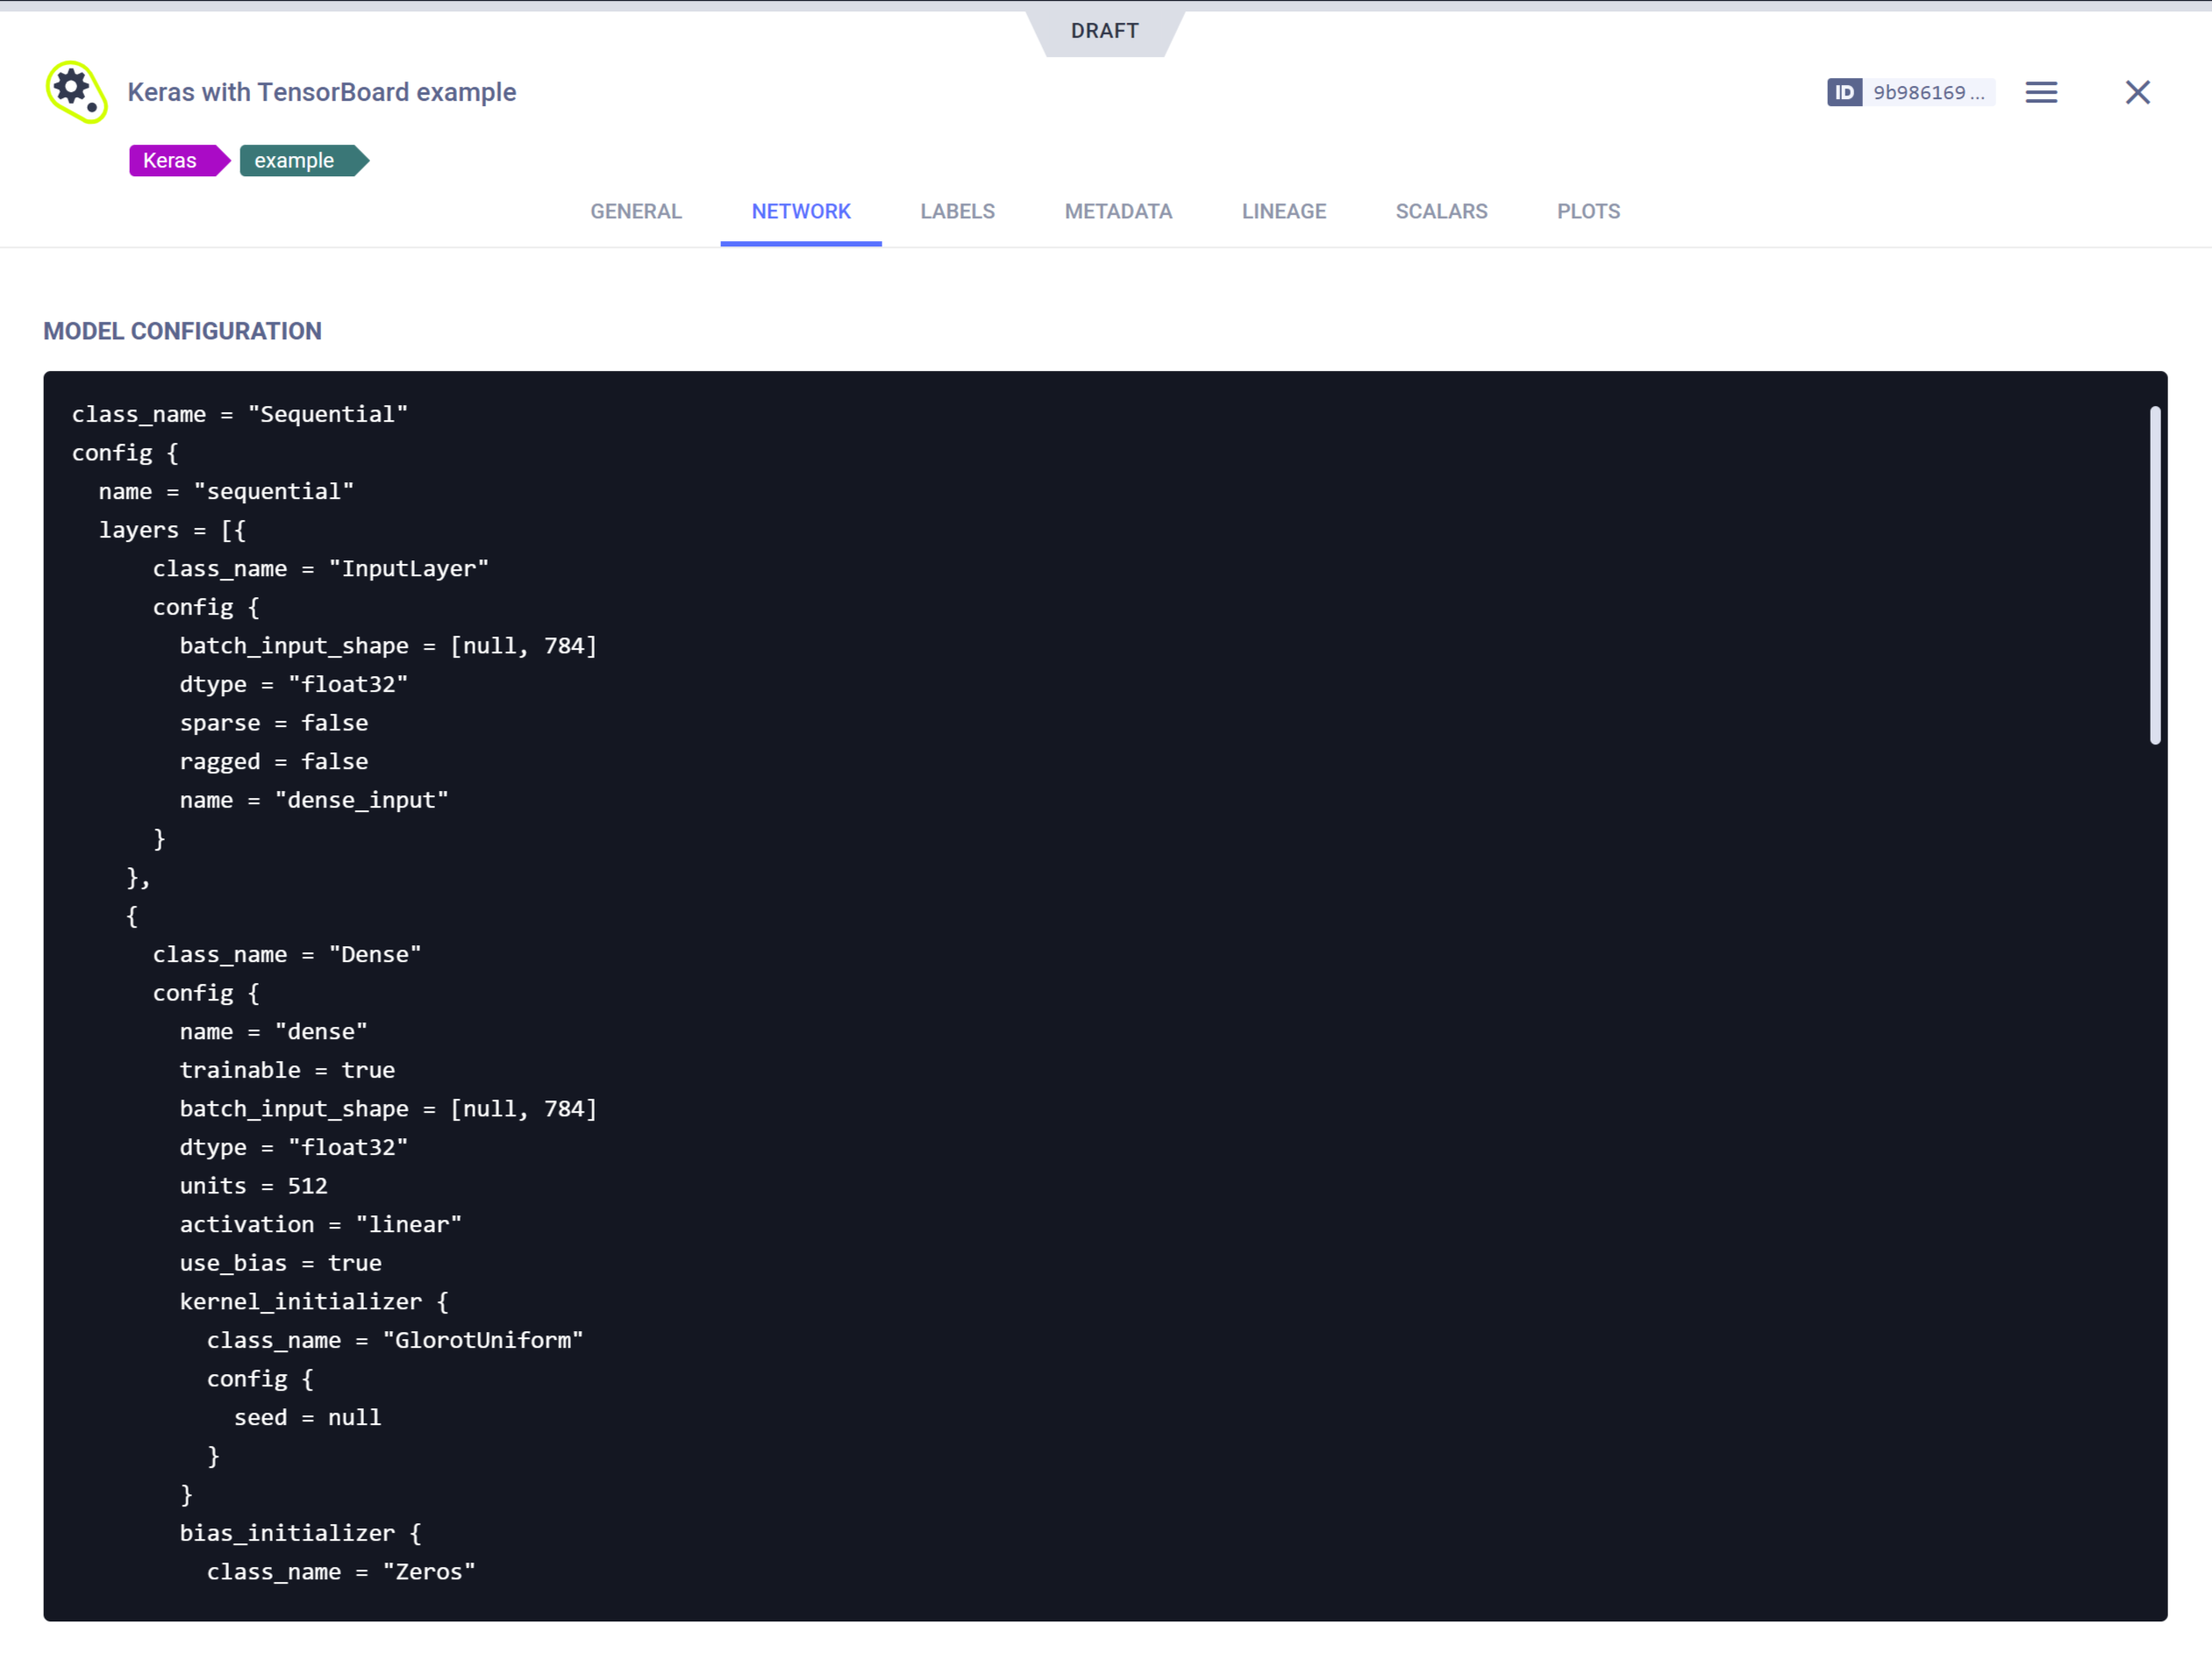
Hover over the model configuration area to access the following actions:
![]()
 Search
 Copy configuration
 CLEAR (for Draft models) - Delete the configuration
- EDIT (for Draft models) - Modify / Add model configuration
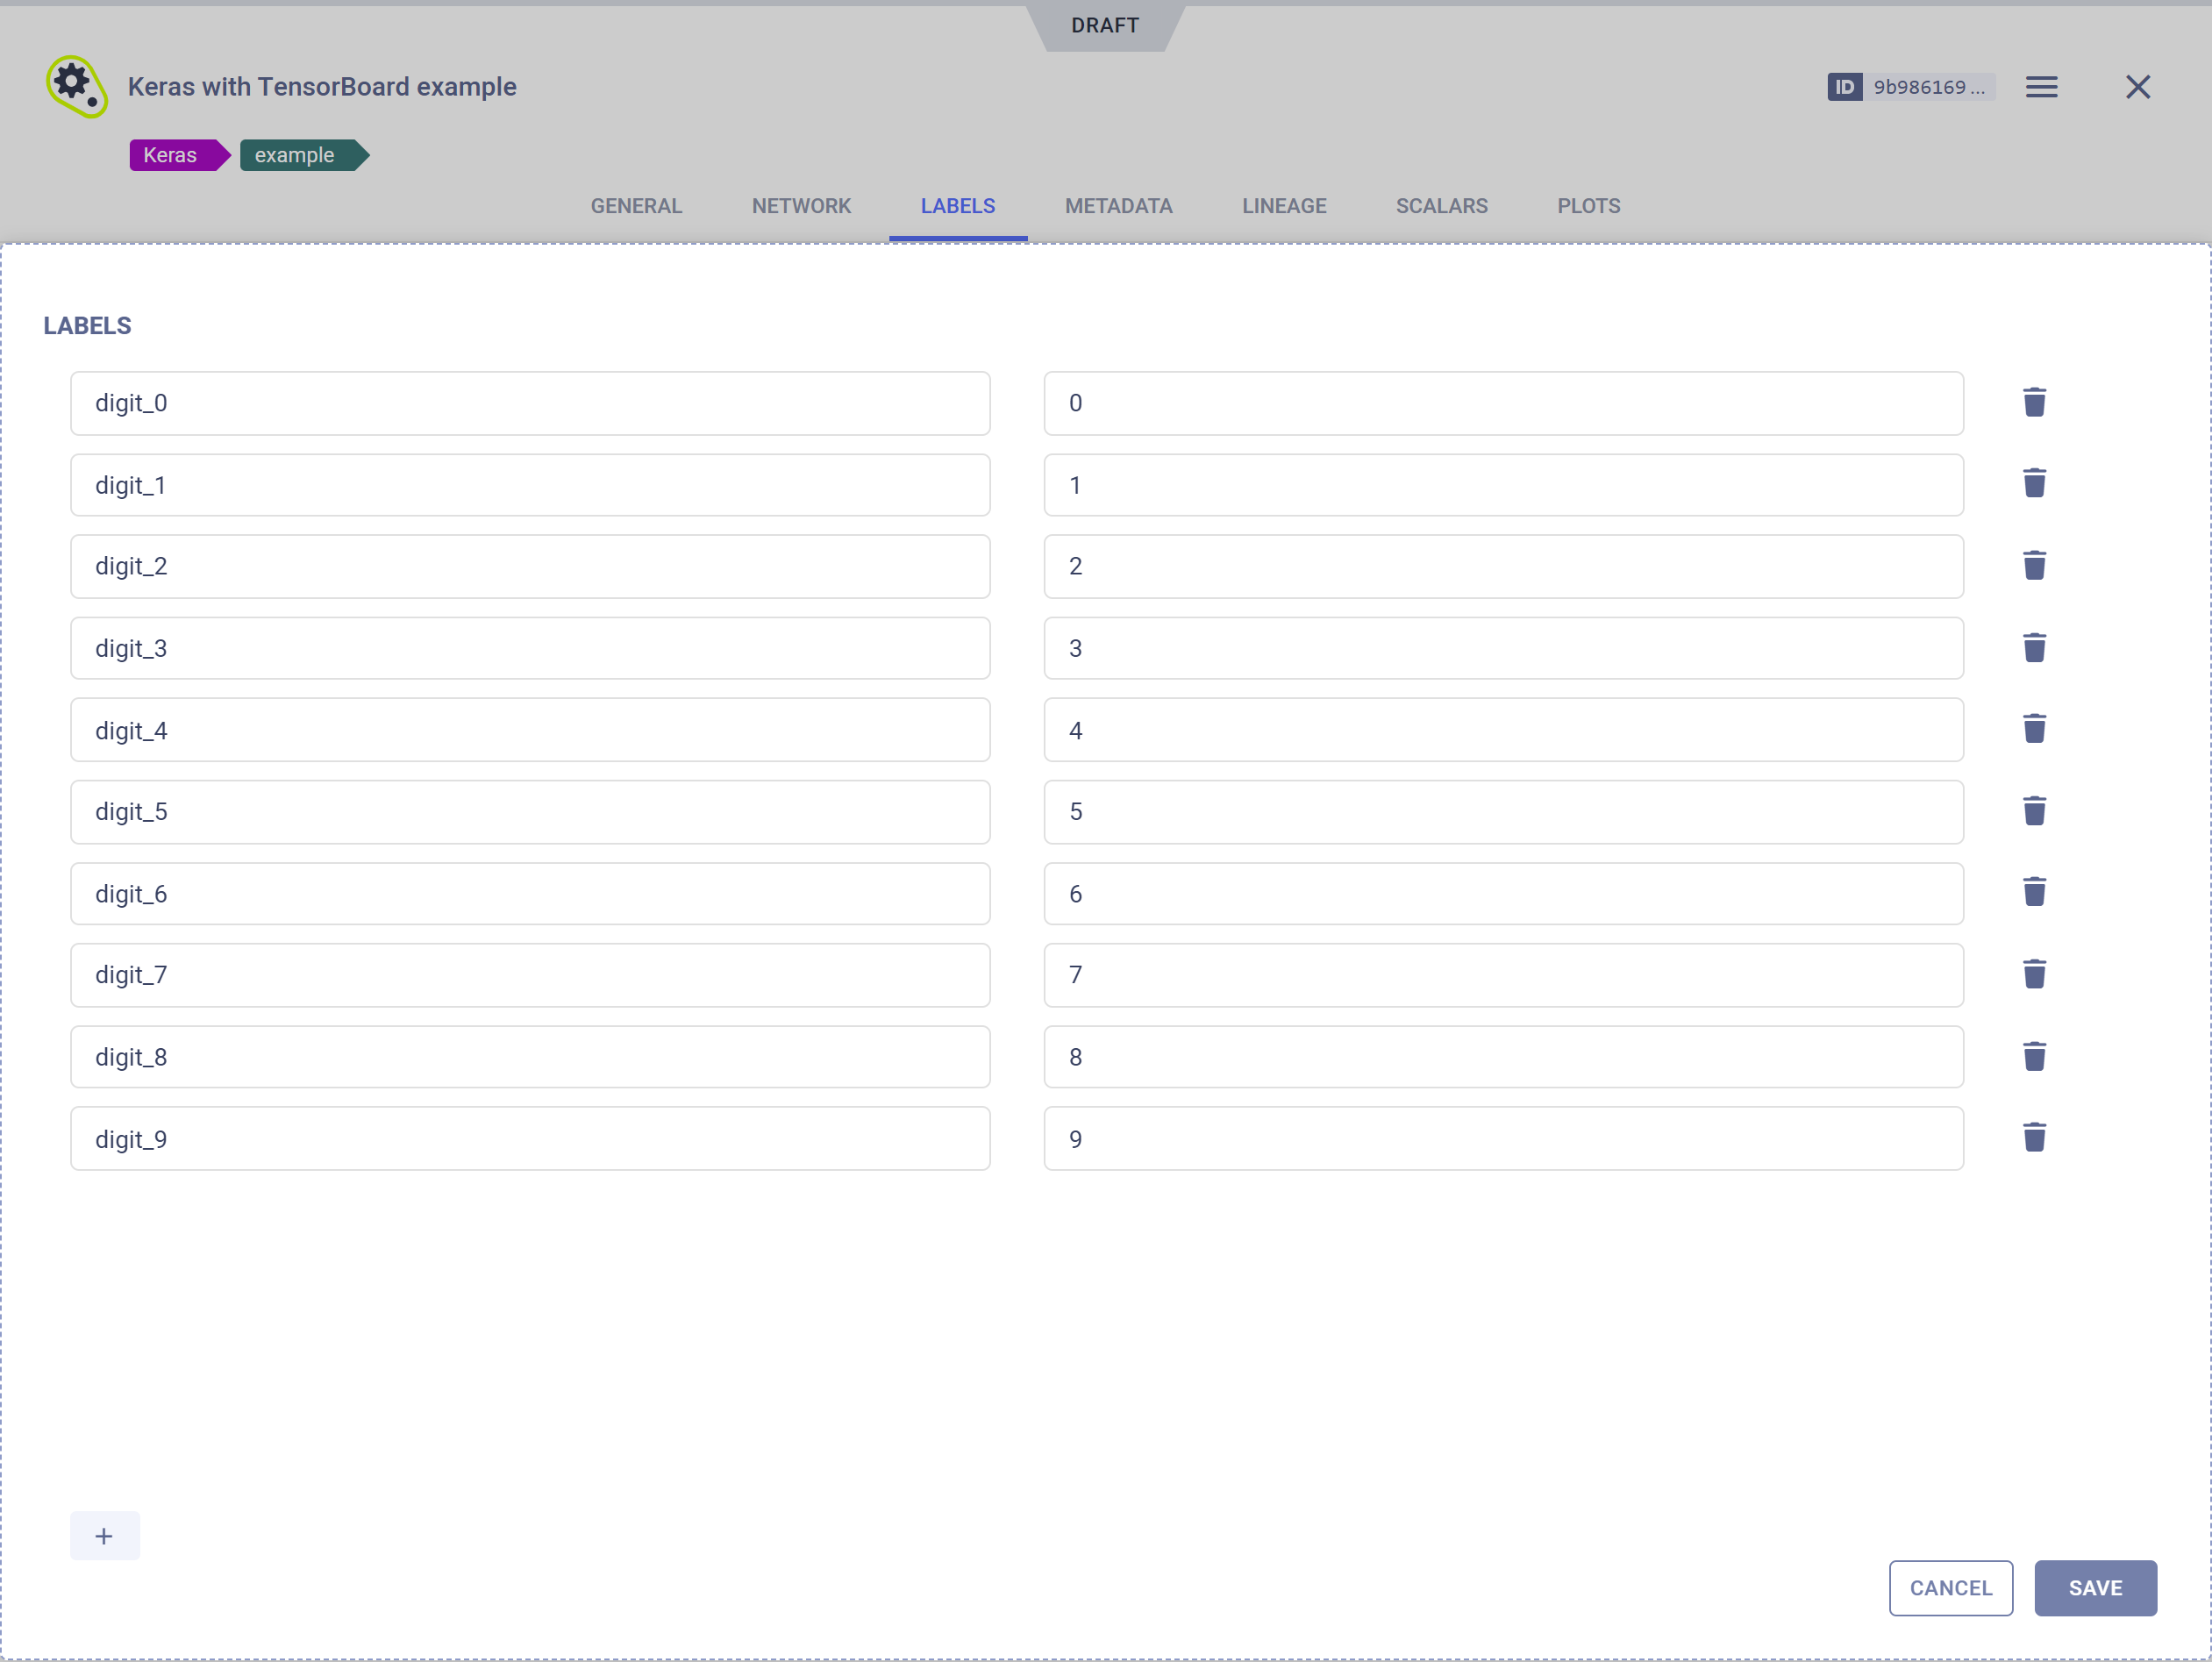
Label Enumeration
The Label Enumeration tab displays for each class label (“Label”) its name and enumerated value (“ID”).
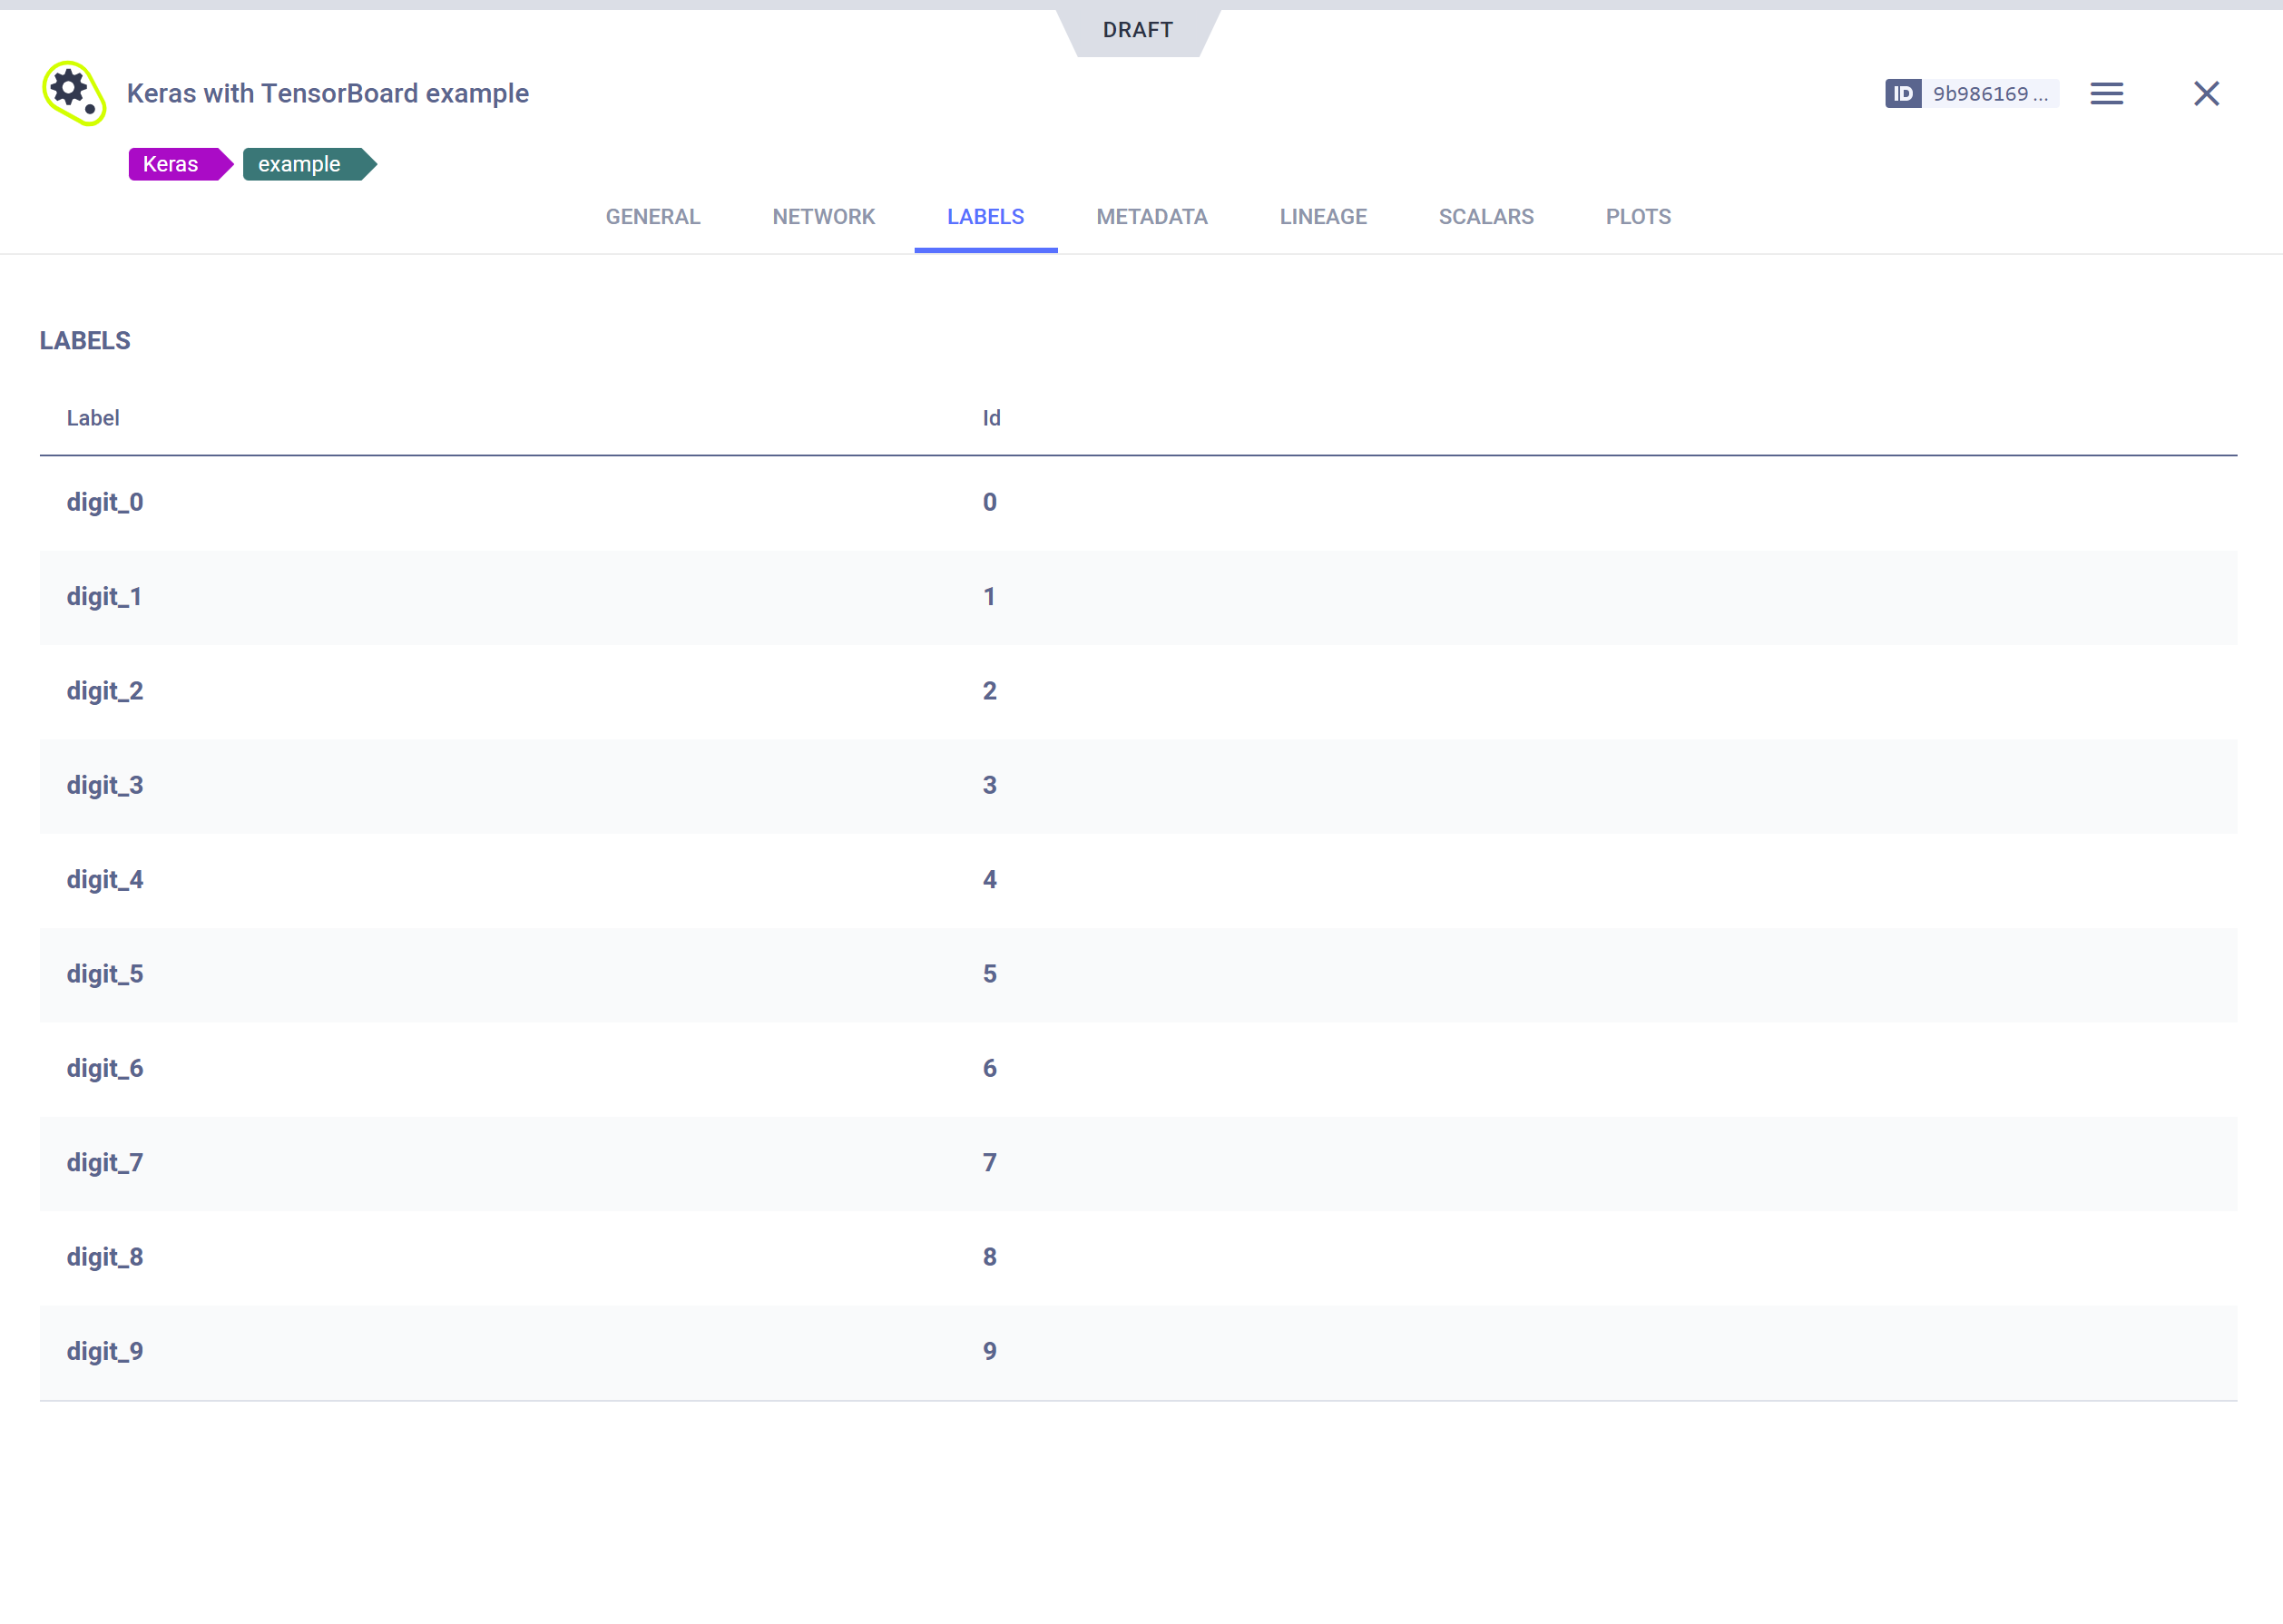
To modify / add / delete class labels (for Draft models), hover over the label table, then click EDIT. This opens the label editing window.
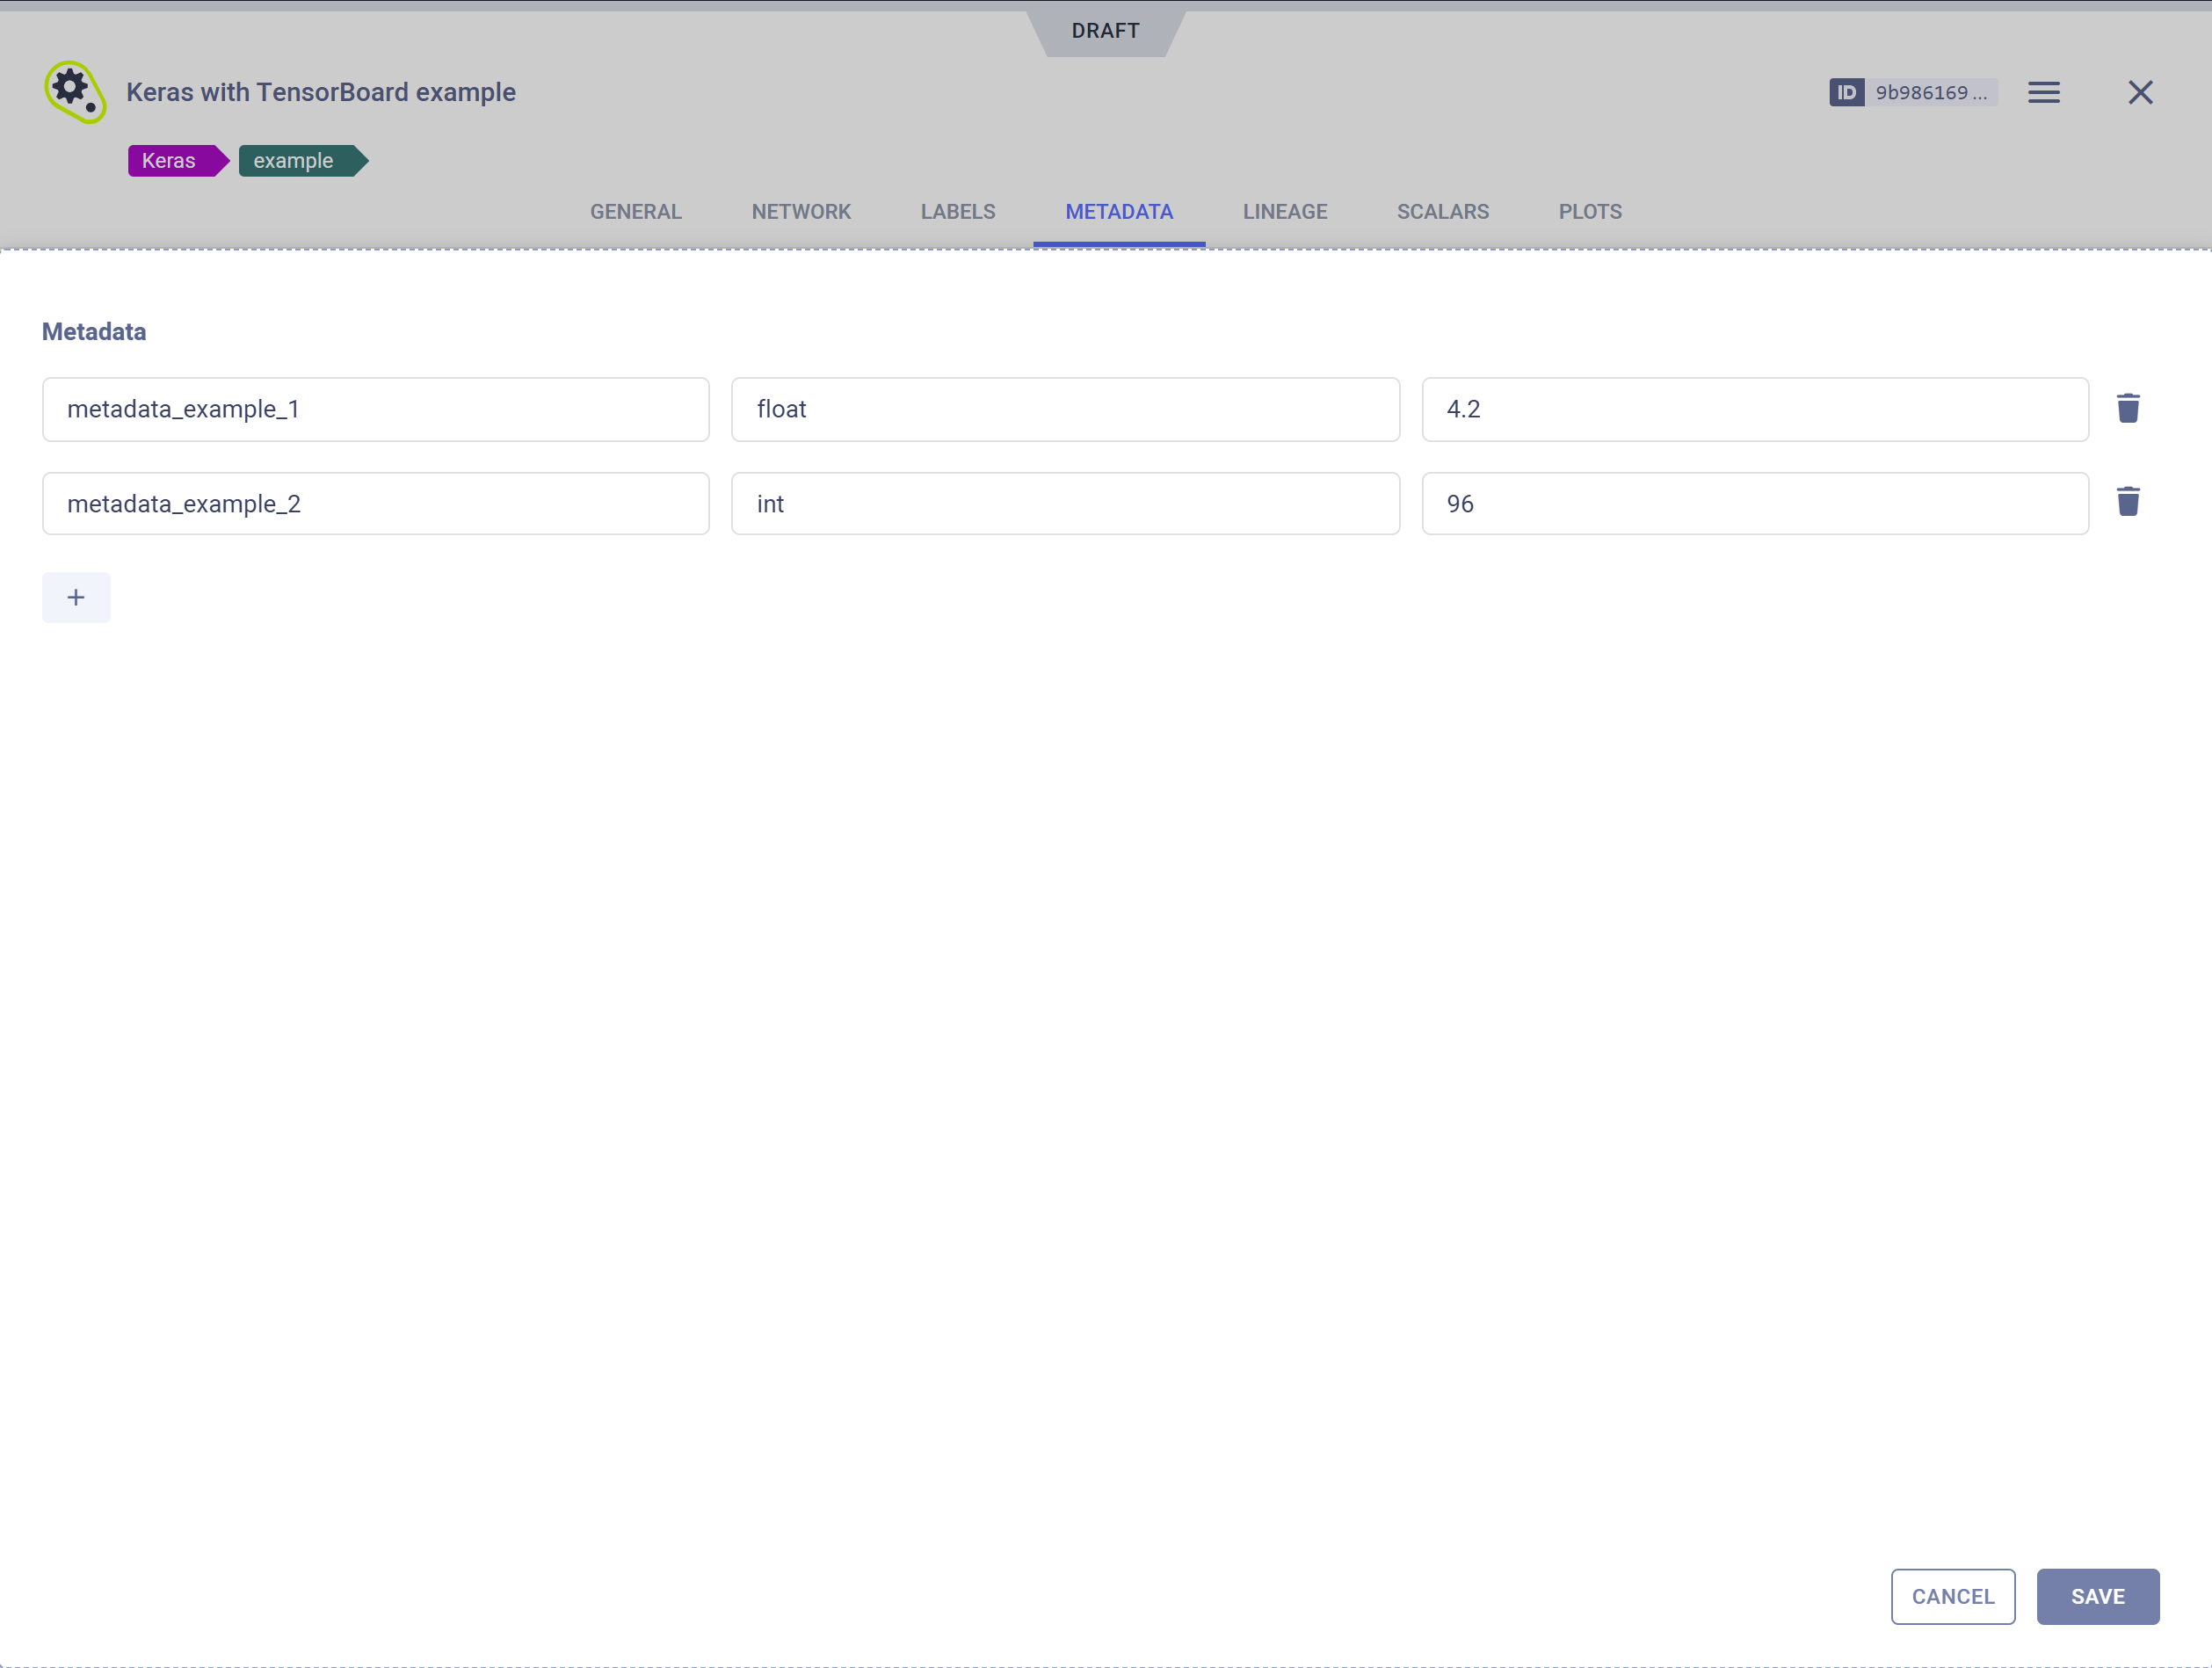
Metadata
The METADATA tab lists the model's metadata entries, which consist of a key, type, and value.
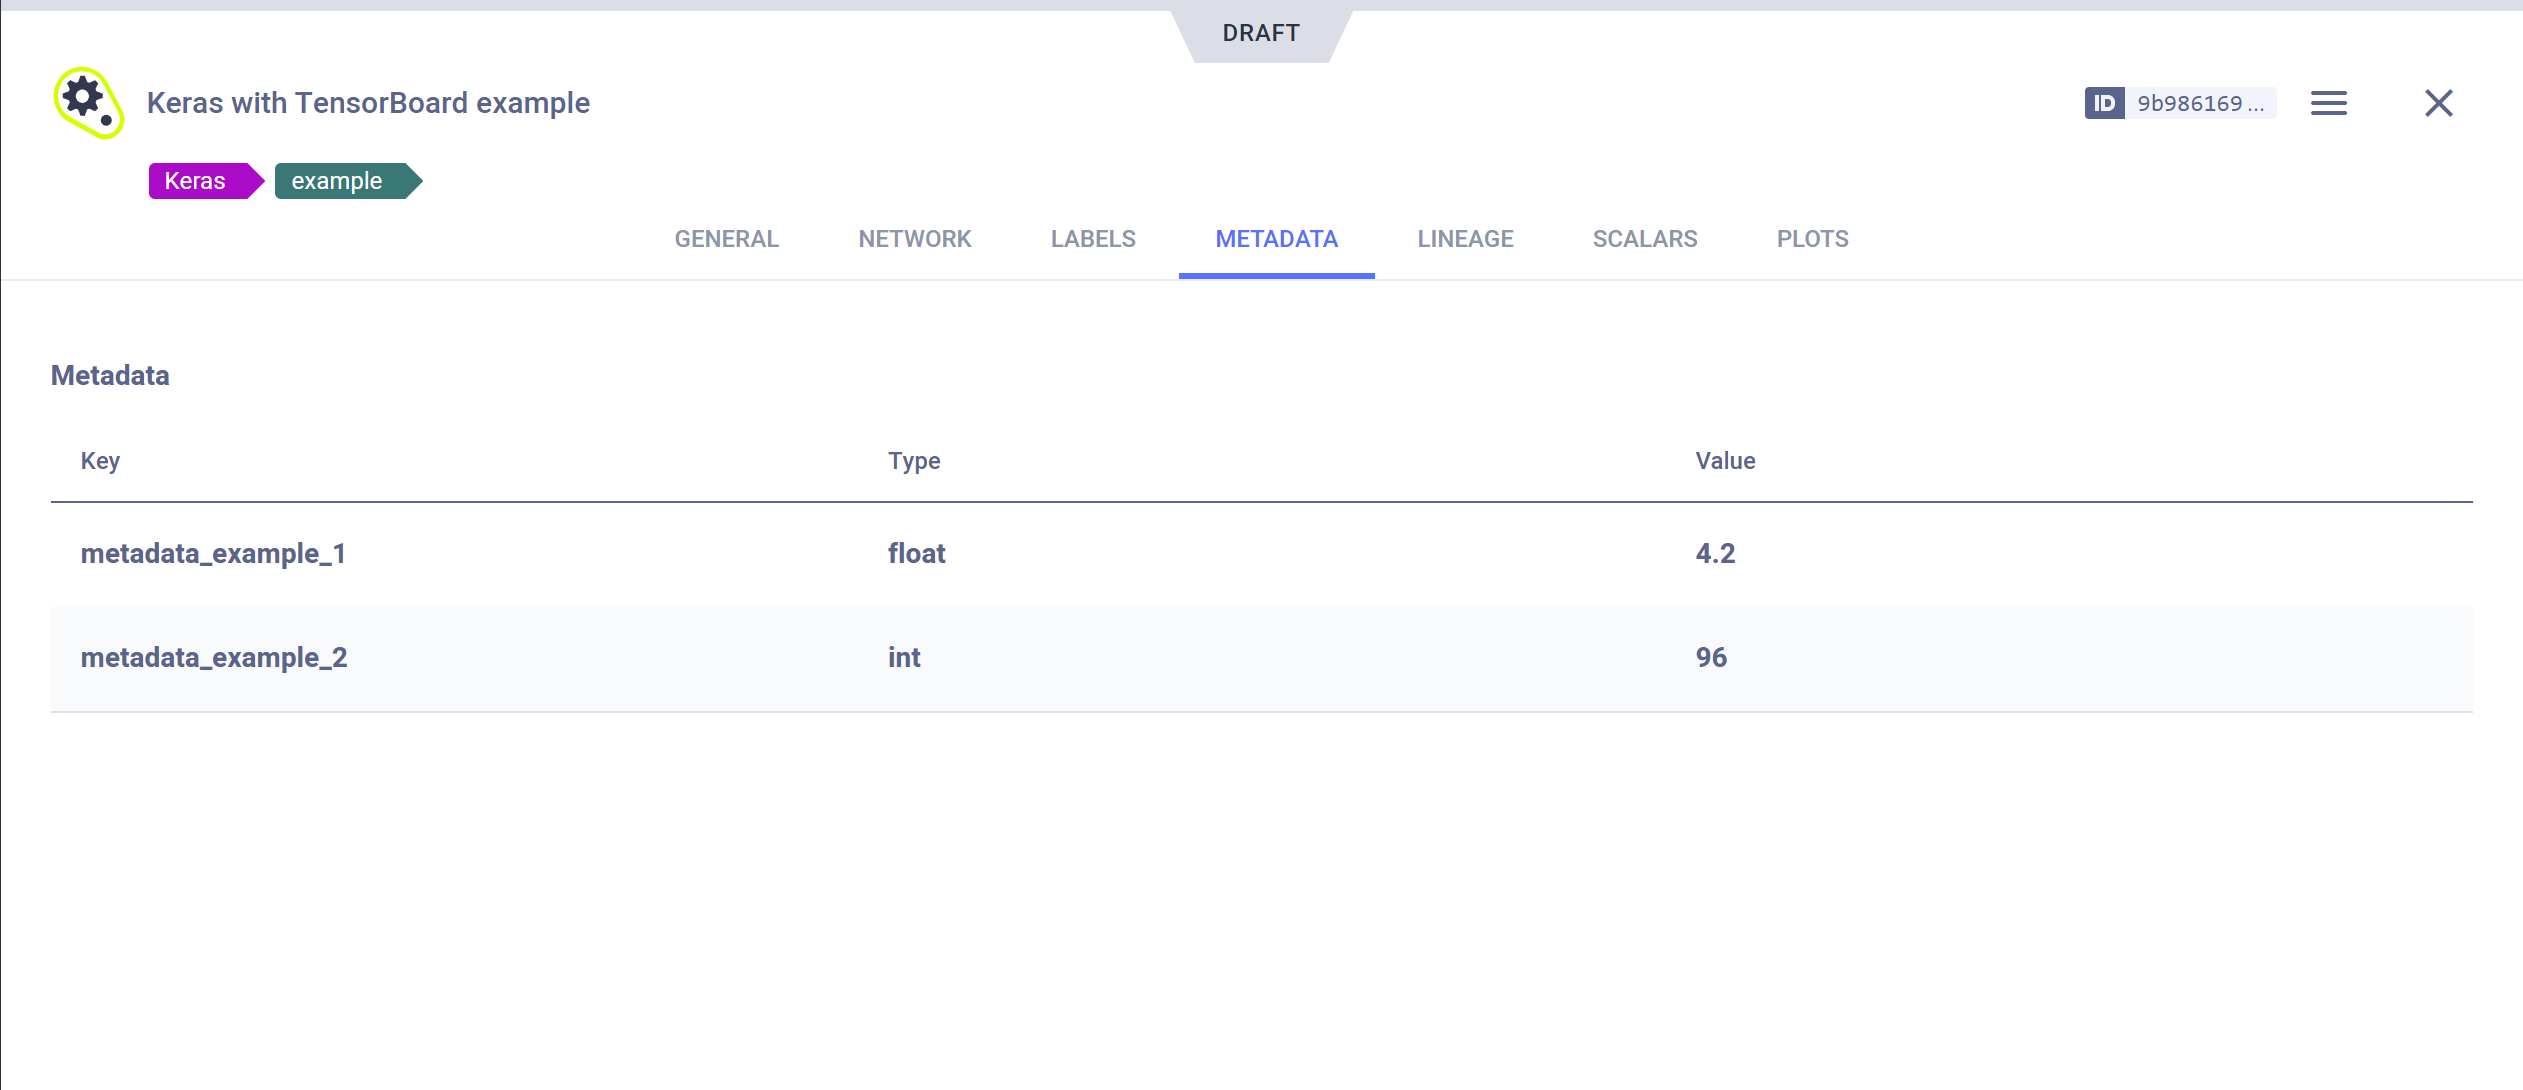
To modify / add / delete model metadata items, hover over Metadata, then click EDIT. This opens the Metadata editing window.
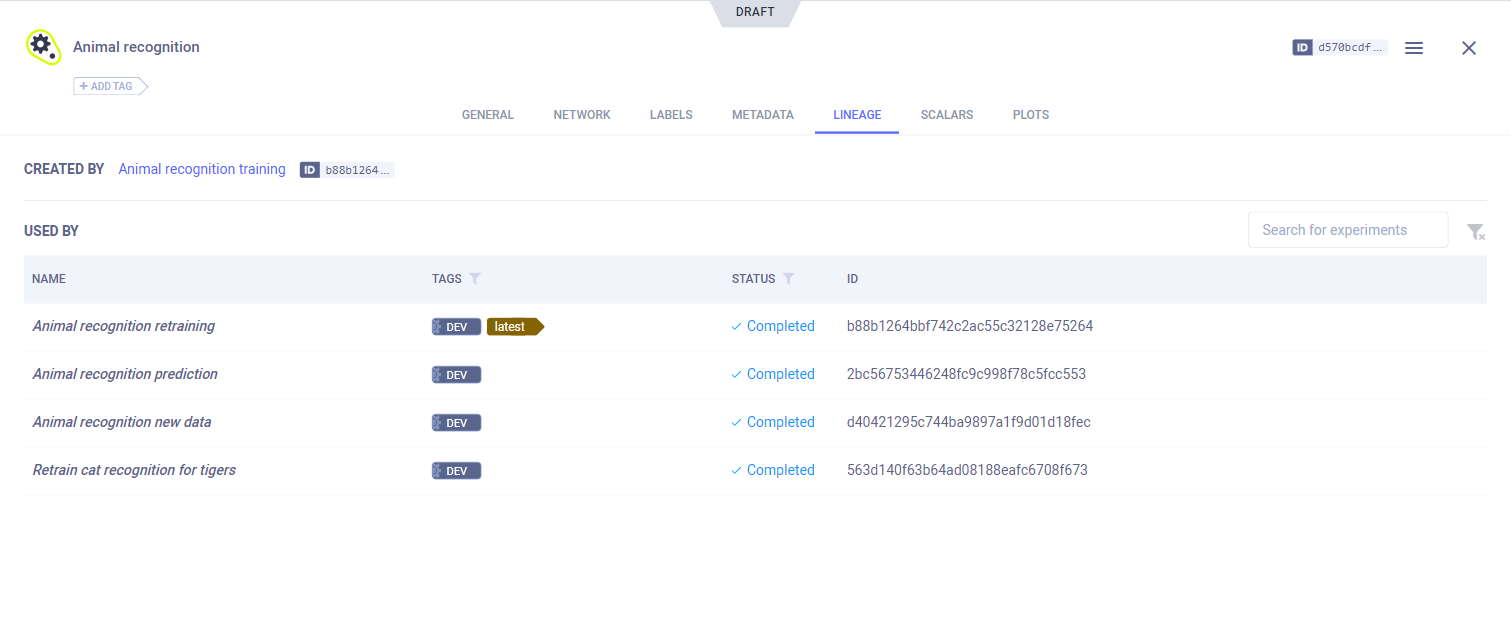
Lineage
The LINEAGE tab displays the model's creating experiment (the ClearML experiment that generated the model) and lists all the tasks where the model is used as an input model. Click an experiment to navigate to its page.
You can filter the task list by tags and task status.
Use the search bar to look for experiments based on their name, ID, or description.
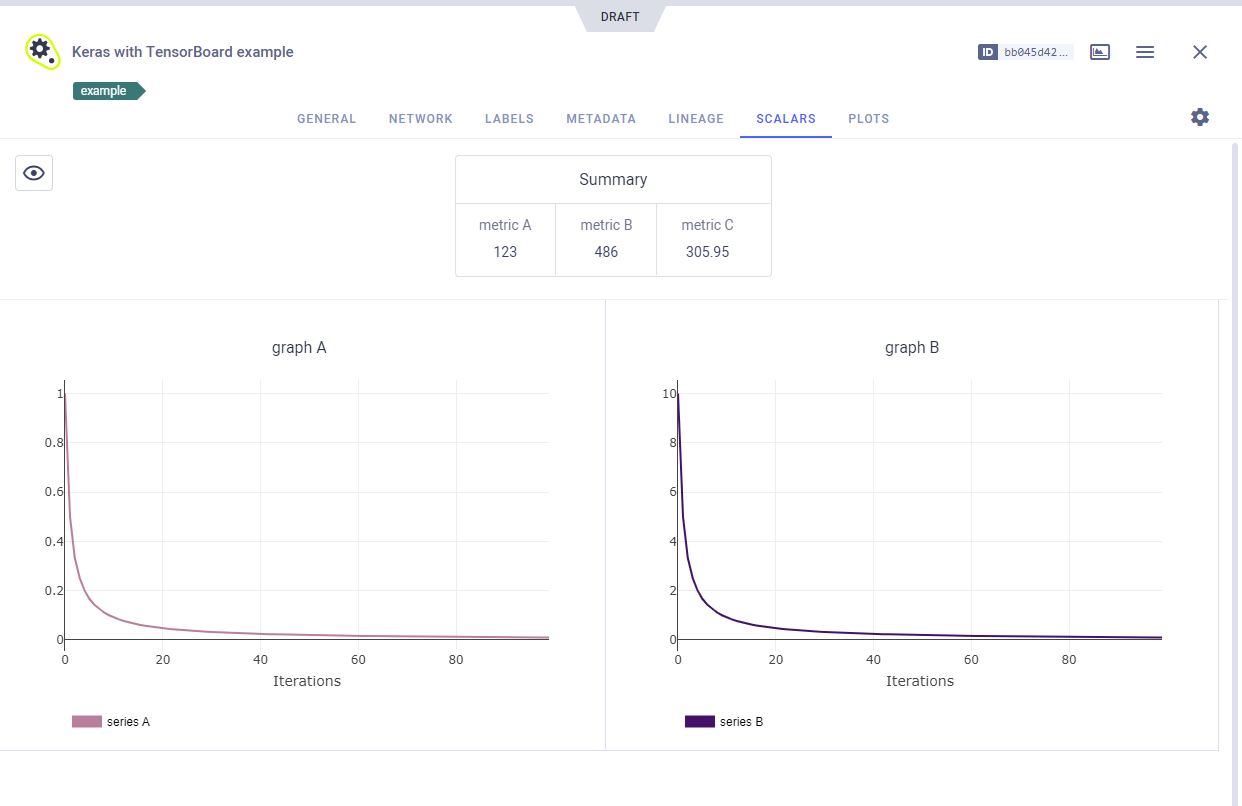
Scalars
The SCALARS tab displays all scalar plots attached to a model. Scalar values are presented as time series line
plots. To see the series for a metric in high resolution, view it in full screen mode by hovering over the graph and
clicking ![]() .
Reported single value scalars are aggregated into a table plot displaying scalar names and values.
.
Reported single value scalars are aggregated into a table plot displaying scalar names and values.
To embed scalar plots in your Reports, hover over a plot and click ![]() ,
which will copy to clipboard the embed code to put in your Reports. In contrast to static screenshots, embedded resources
are retrieved when the report is displayed allowing your reports to show the latest up-to-date data.
,
which will copy to clipboard the embed code to put in your Reports. In contrast to static screenshots, embedded resources
are retrieved when the report is displayed allowing your reports to show the latest up-to-date data.
For better plot analysis, see Plot Controls.
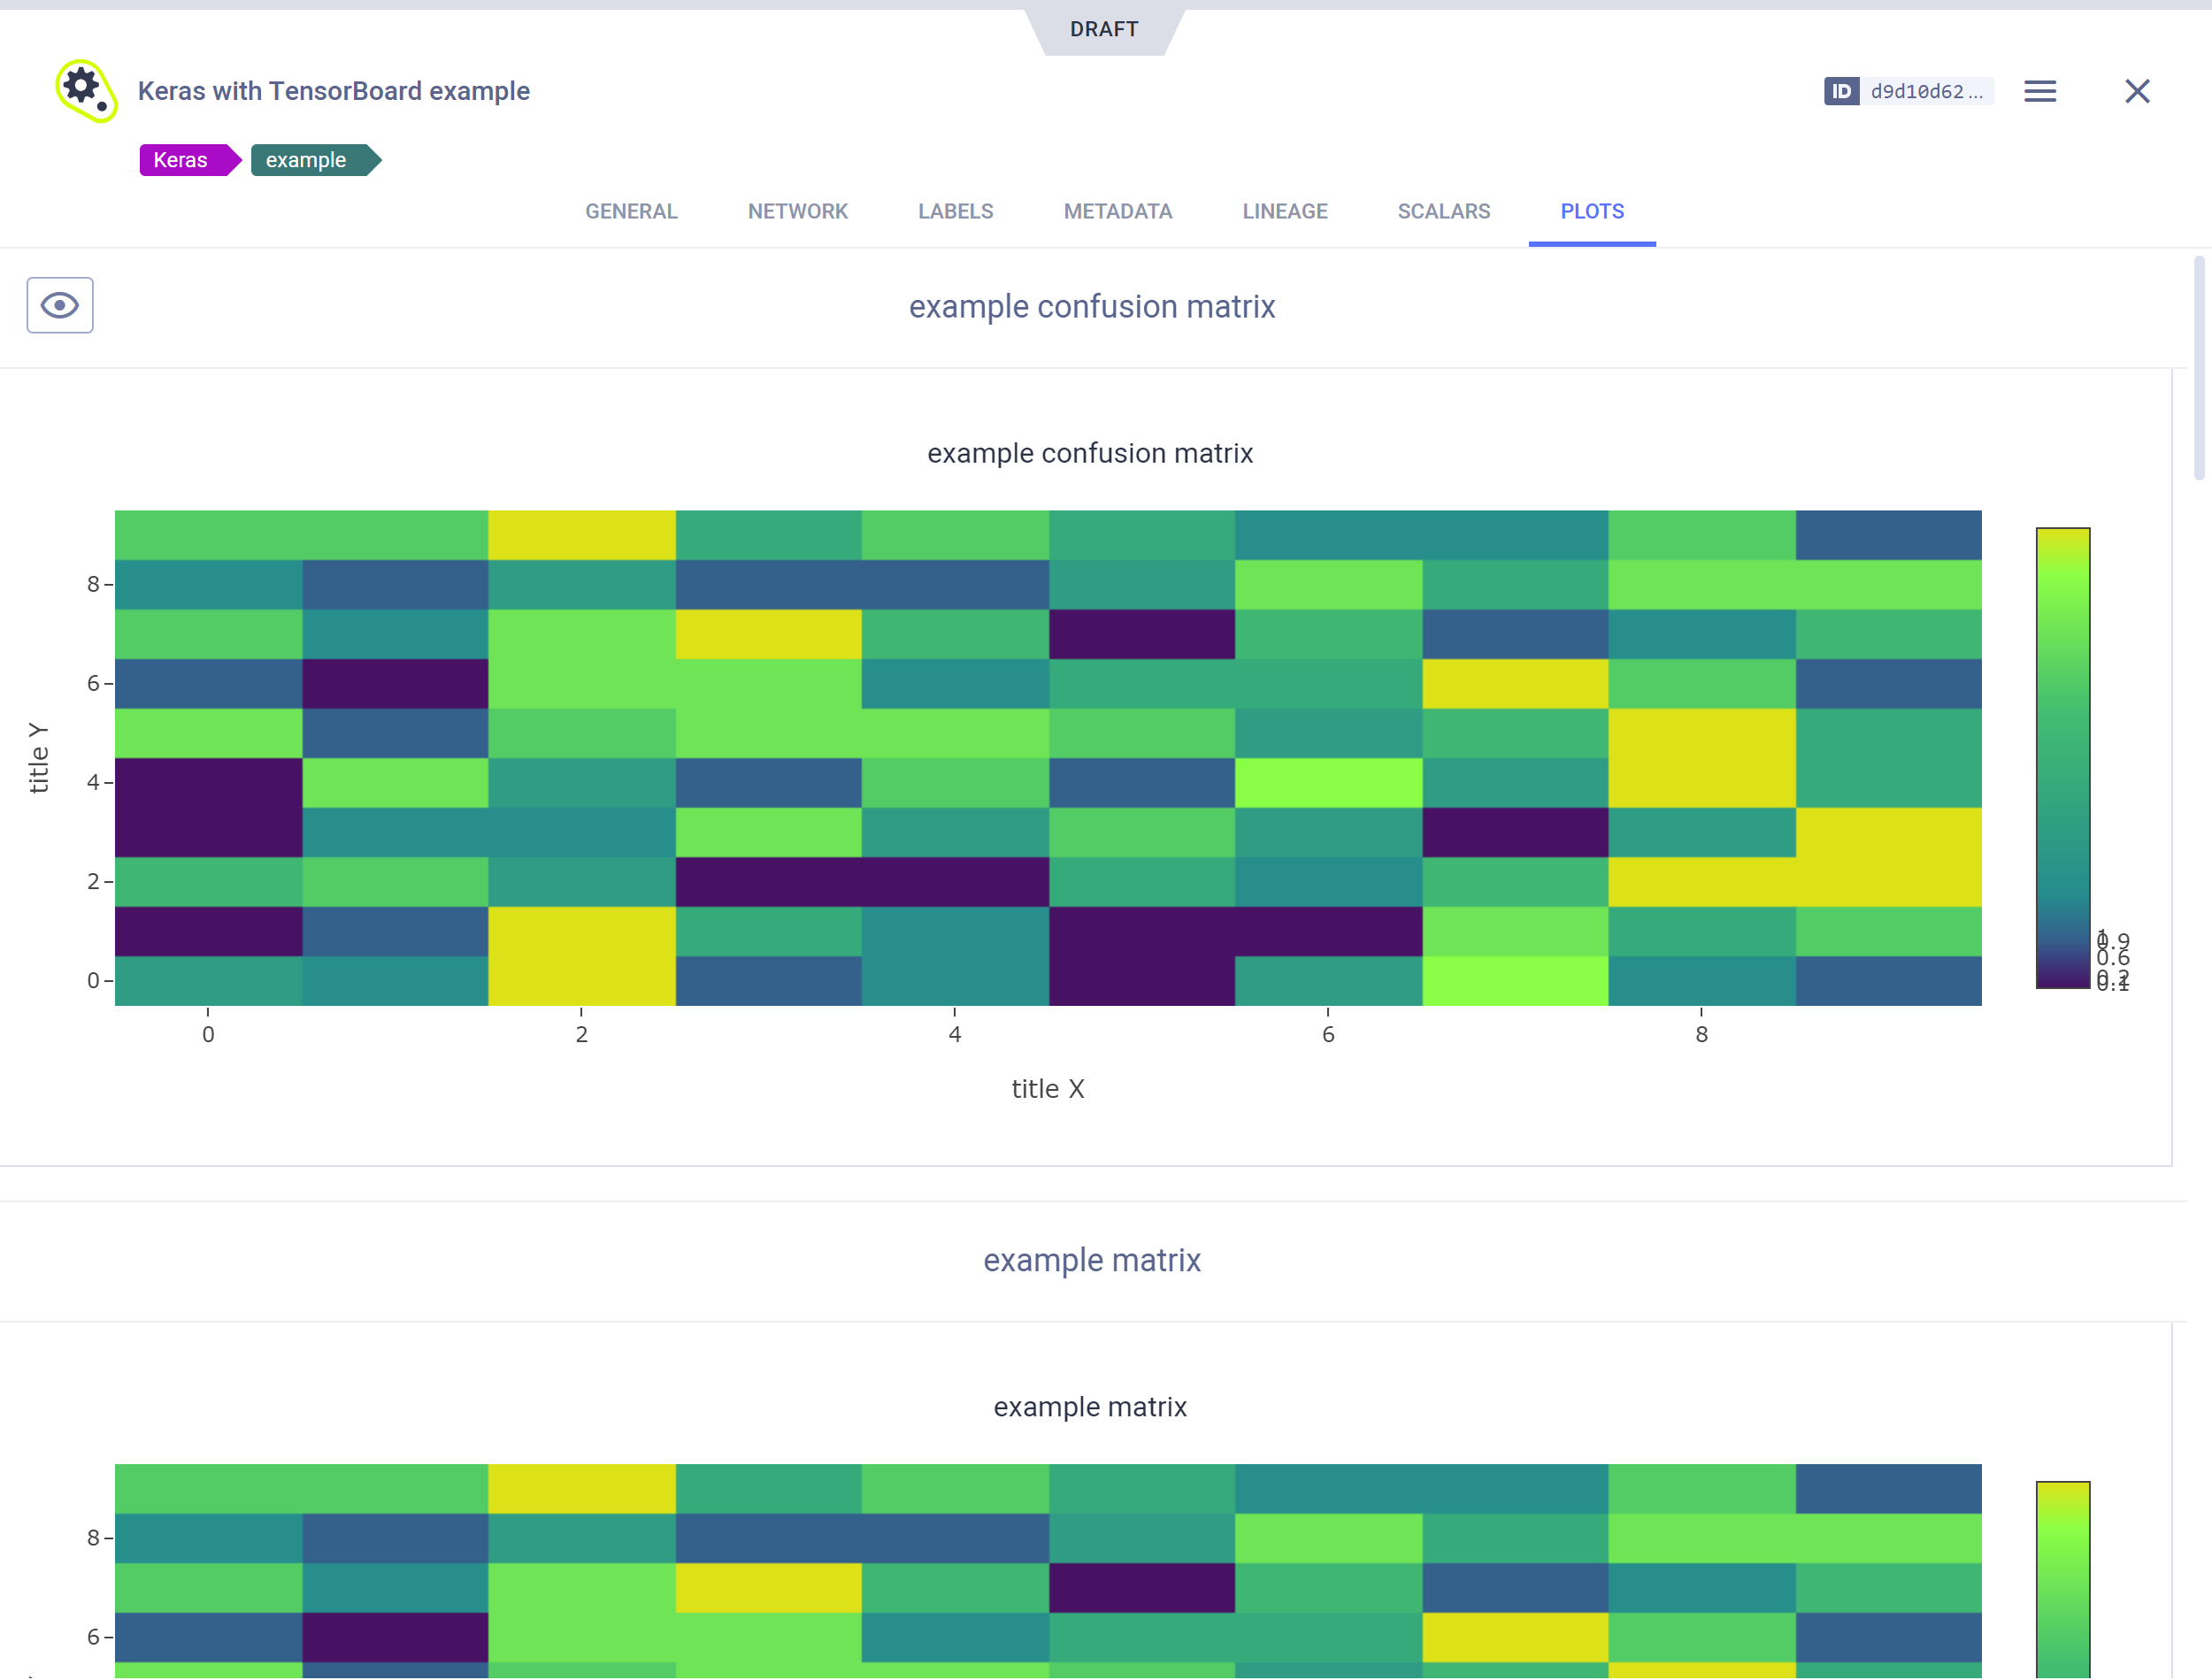
Plots
The PLOTS tab displays plots attached to a model.
To embed plots in your Reports, hover over a plot and click ![]() ,
which will copy to clipboard the embed code to put in your Reports. In contrast to static screenshots, embedded resources
are retrieved when the report is displayed allowing your reports to show the latest up-to-date data.
,
which will copy to clipboard the embed code to put in your Reports. In contrast to static screenshots, embedded resources
are retrieved when the report is displayed allowing your reports to show the latest up-to-date data.
For better plot analysis, see Plot Controls.