Comparing Models
The ClearML Web UI provides features for comparing models, allowing to locate, visualize, and analyze model differences. You can view the differences in model details, configuration, scalar values, and more.
Selecting Models to Compare
To select models to compare:
- Go to a models table that includes the models to be compared.
- Select the models to compare. Once multiple models are selected, the batch action bar appears.
- In the batch action bar, click COMPARE.
The comparison page opens in the DETAILS tab, with the models compared side by side.
Modifying Model Selection
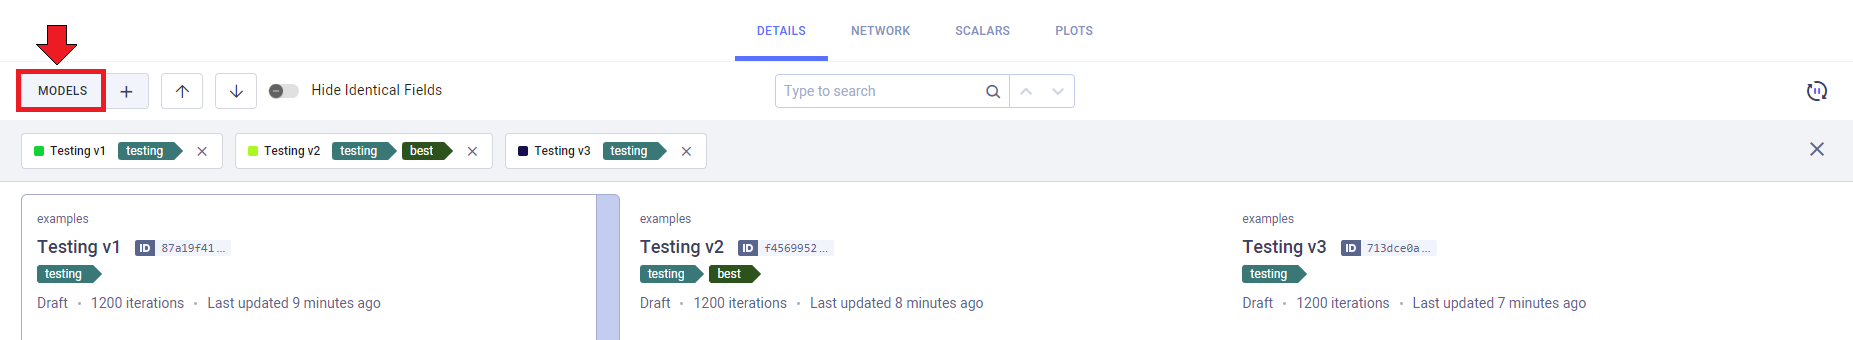
Click the MODELS button to view your currently compared models. Click X on a listed model to remove
it from the comparison.
You can add/remove models to your comparison:
- Click the
+button in any of the comparison tabs. This opens up a window with a model table with the currently compared models at the top.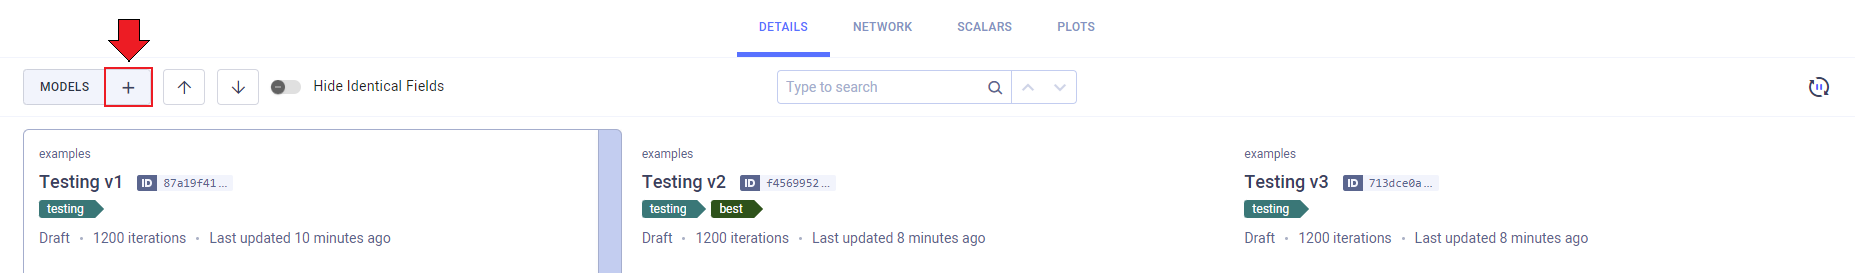
- Find the models to add by sorting and filtering the models with the appropriate column header controls. Alternatively, use the search bar to find models by name.
- Select models to include in the comparison (and/or clear the selection of any models you wish to remove).
- Click APPLY.
Sharing Comparison Page
To share a comparison page, copy the full URL from the address bar and send it to a teammate to collaborate. They will get the exact same page (including selected tabs etc.).
Embedding Comparison Visualization
To embed plots and debug samples from the comparison pages in your Reports, hover over the
resource and click ![]() ,
which will copy to clipboard the embed code to put in your Reports. These visualizations are updated live as the
models update. The Enterprise Plan and Hosted Service support embedding resources in external tools (e.g. Notion).
,
which will copy to clipboard the embed code to put in your Reports. These visualizations are updated live as the
models update. The Enterprise Plan and Hosted Service support embedding resources in external tools (e.g. Notion).
Comparison Modes
The comparison tabs provides the following views:
- Side-by-side textual comparison
- Tabular scalar comparison
- Merged plot comparison
- Side-by-side graphic comparison
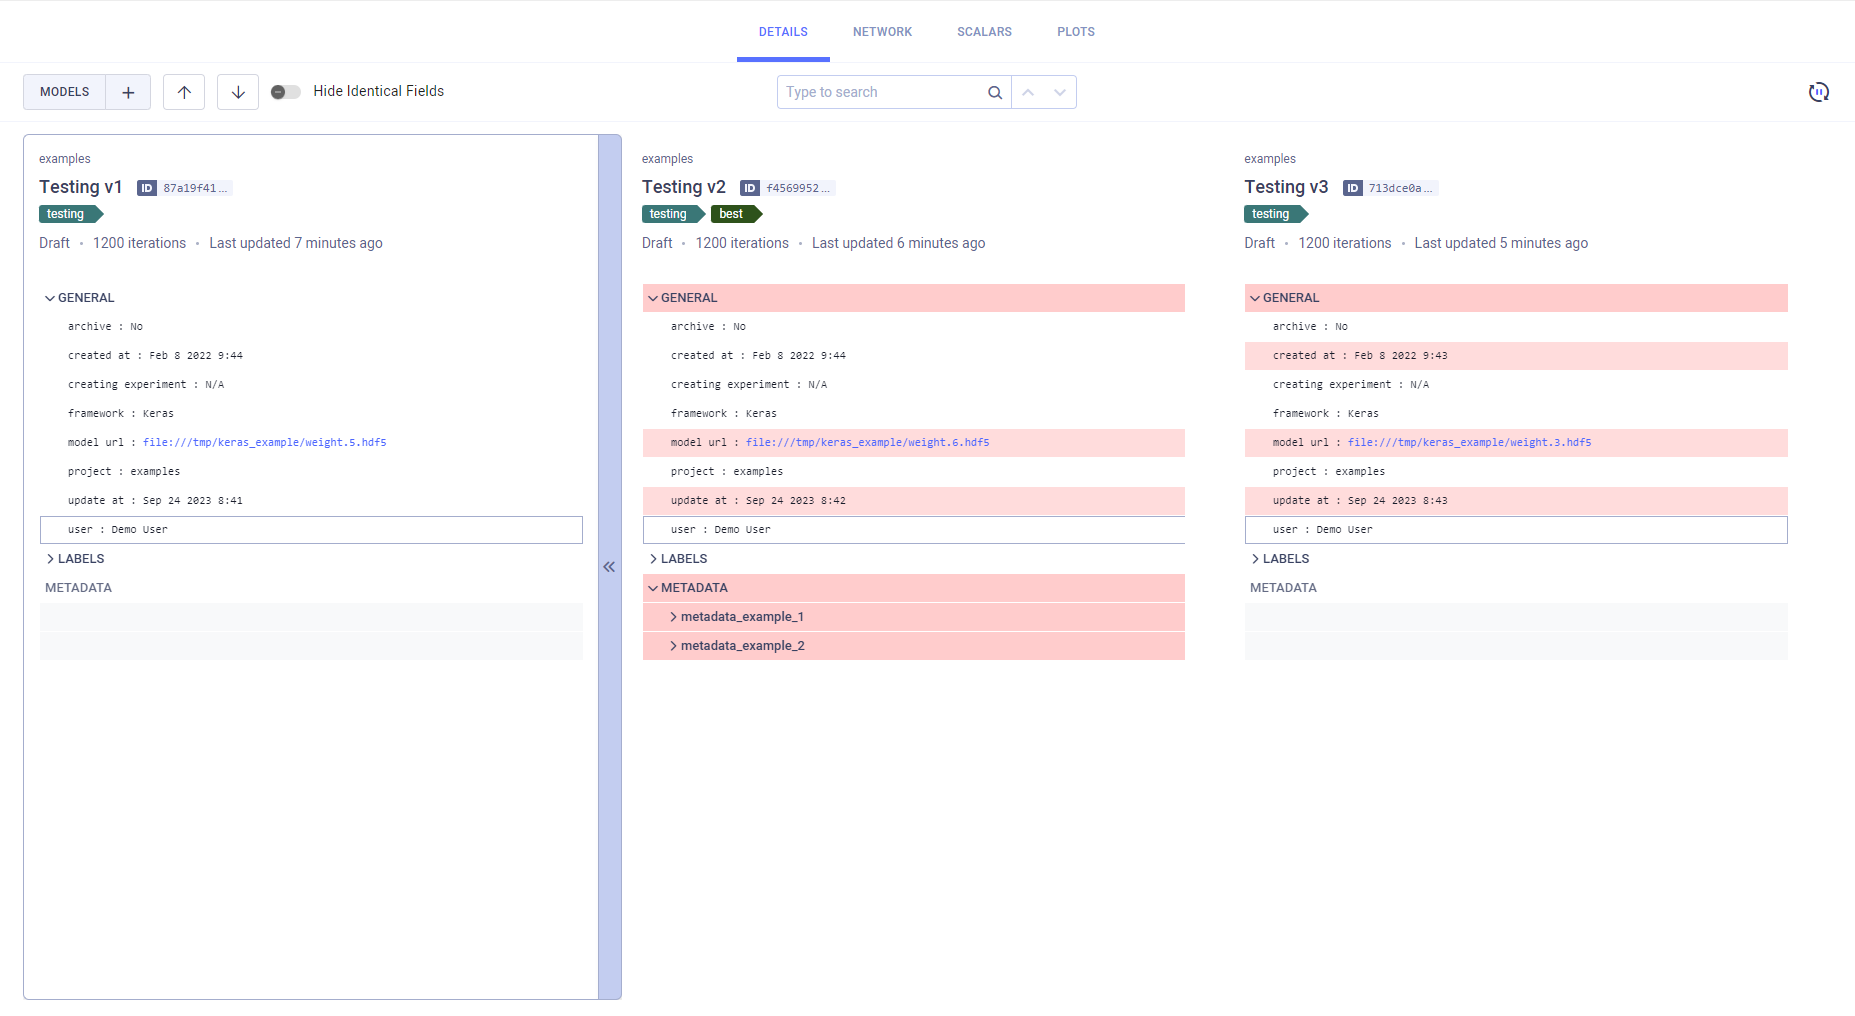
Side-by-side Textual Comparison
In the Details and Network tabs, you can view differences in the models' nominal values. Details displays the models' general information, labels, metadata, and lineage. Network displays the models' configuration. Each model's information is displayed in a column, so each field is lined up side-by-side.
The model on the left is used as the base model, to which the other models are compared. You can set a new base model in one of the following ways:
- Click
 on the top right of the model that will be the new base.
 - Click on the new base model and drag it all the way to the left
The differences between the models are highlighted. You can obscure identical fields by switching on the Hide Identical Fields toggle.
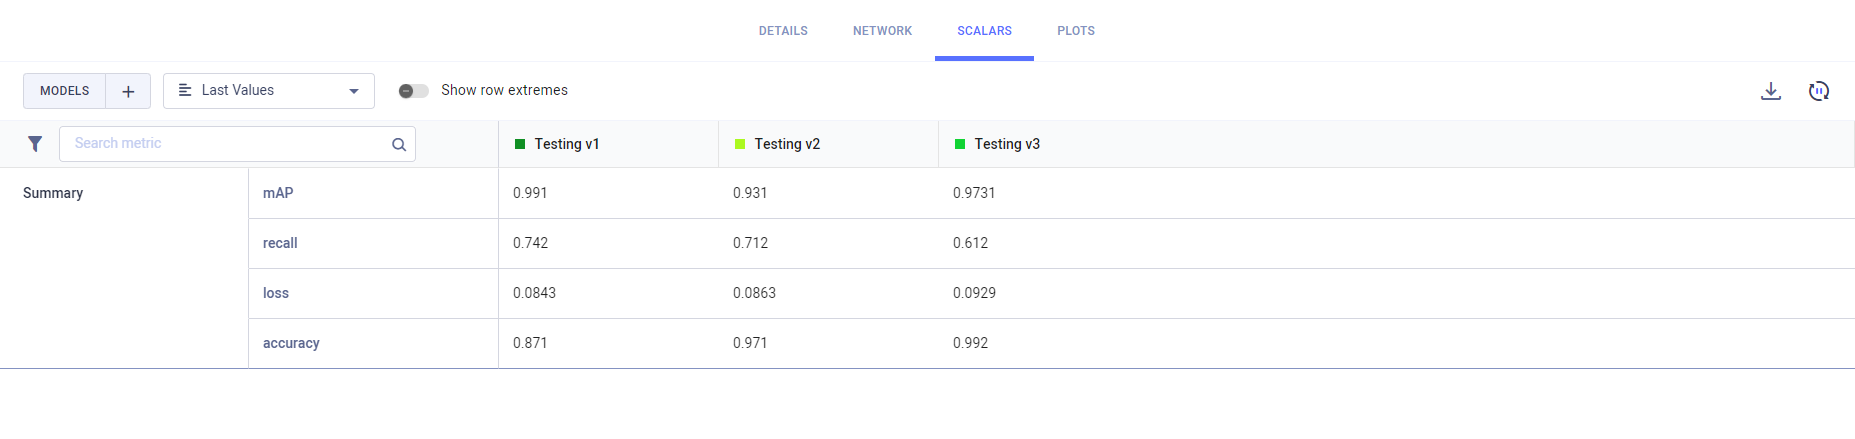
Tabular Scalar Comparison
The Scalars tab (Values view) lays out the models' reported metric values in a table: a row per metric/variant and a column for each model. Select from the dropdown menu which metric values to display:
- Last Values: The last reported values for each model
- Min Values: The minimal value reported
- Max Values: The maximal value reported
You can download the scalar comparison table as a CSV file by clicking ![]() .
.
Switch on the Show row extremes toggle to highlight each variant's maximum and minimum values.
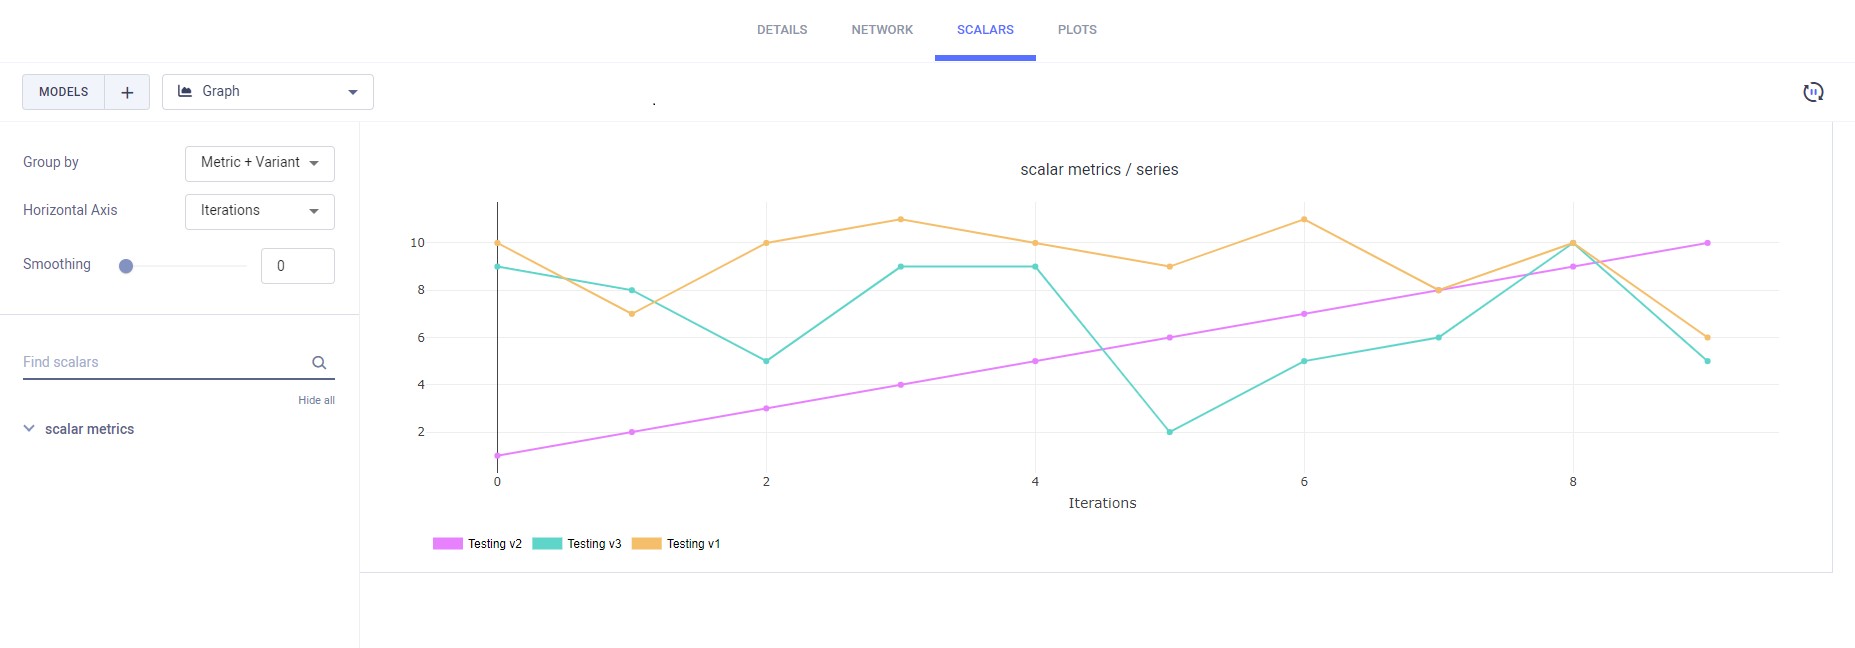
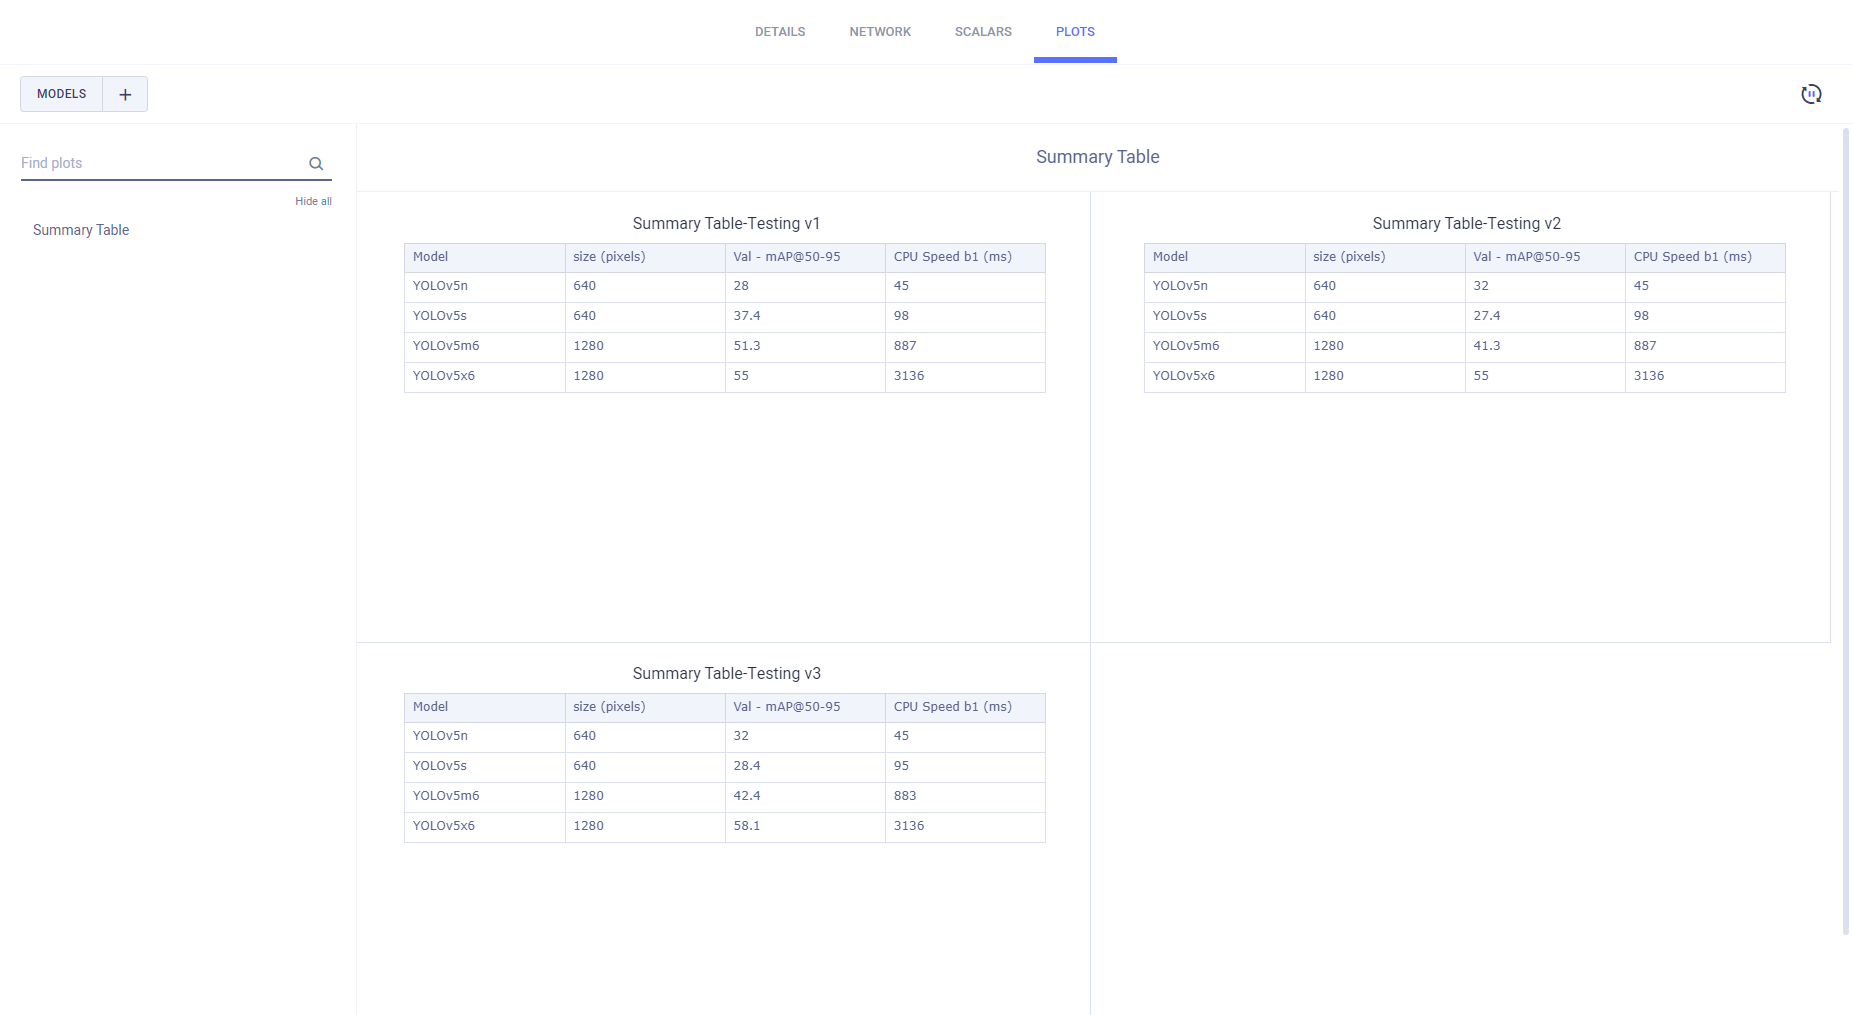
Graphic Comparison
The Scalars (Graph view) and Plots tabs display plots attached to the models. The Scalars tab compares scalar values as time series line charts. The Plots tab compares the last reported iteration sample of each metric/variant combination per compared model.
Line, scatter, and bar graphs are compared by a single plot per metric/variant into which the plots of all compared models are combined.
Other plot types are displayed separately for each model.
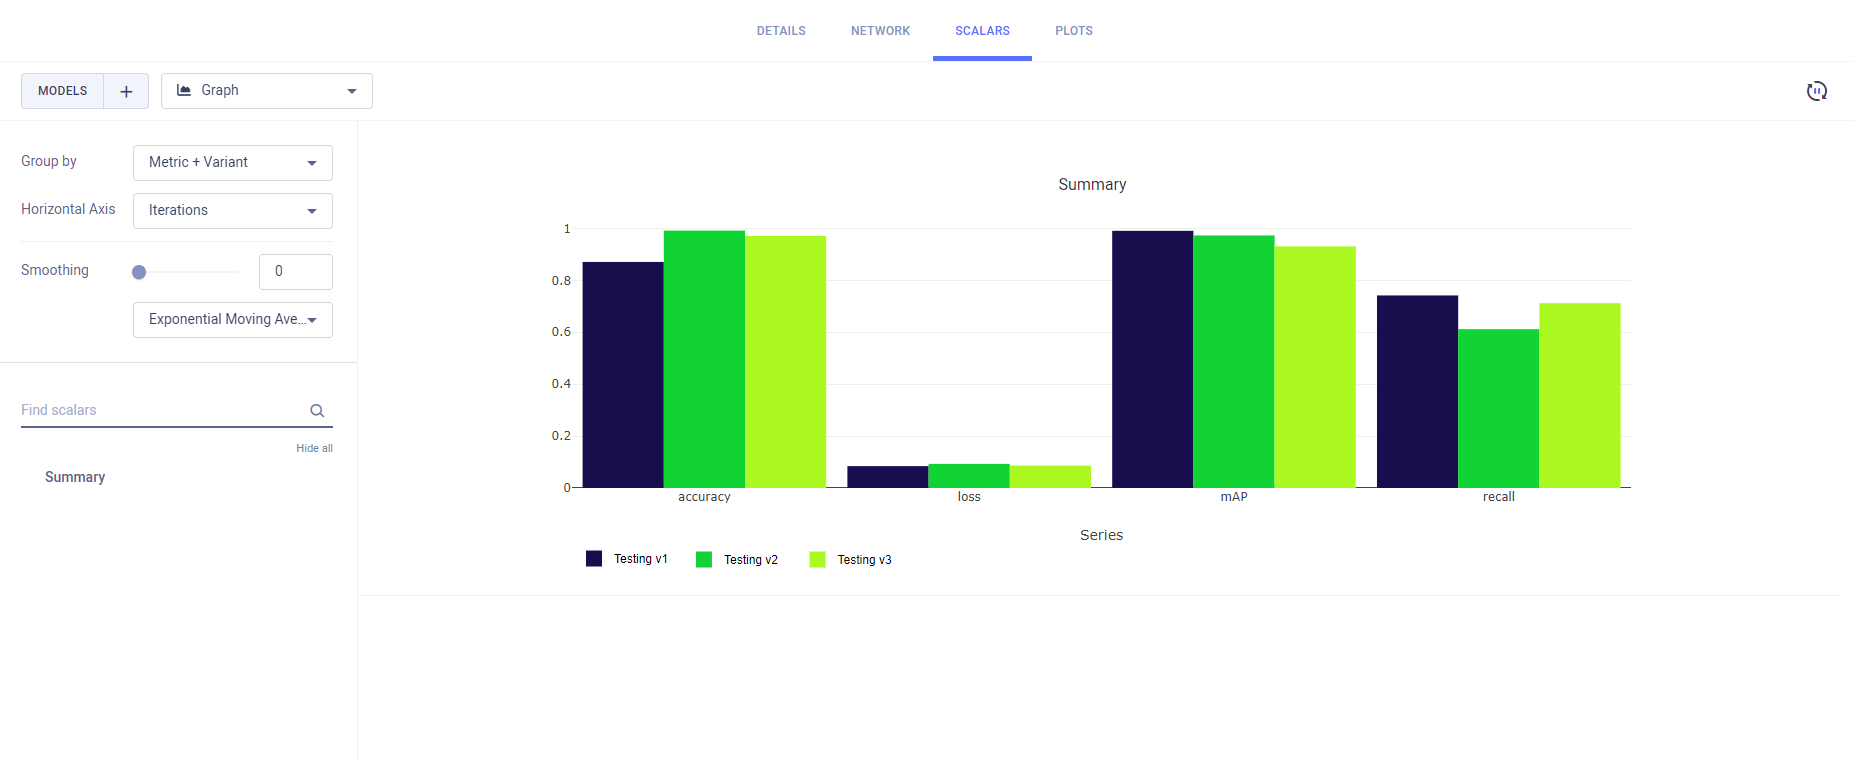
All single value scalars are plotted into a single clustered bar chart under the "Summary" title, where each cluster represents a reported metric, and each bar in the cluster represents a model.
For better plot analysis, see Plot Controls.