Comparing Experiments
The ClearML Web UI provides features for comparing experiments, allowing to locate, visualize, and analyze the differences in experiments' results and their causes. You can view the differences in:
- Details - Compare experiment source code, package versions, models, configuration objects, and other details.
- Hyperparameters
- Values - Compare parameters and their values
- Parallel coordinates - View the impact of hyperparameters on selected metrics
- Scatter plot - View the correlation between a selected hyperparameter and metric
- Scalars - Compare experiment metrics:
- Plots - Compare experiment plots
- Debug samples - Compare debug samples by iteration
With these comparisons, you can investigate the impact of different setups on your experiment results, and gain insight for crafting future experiments.
Selecting Experiments to Compare
To select experiments to compare:
- Go to an experiments table that includes the experiments to be compared.
- Select the experiments to compare. Once multiple experiments are selected, the batch action bar appears.
- In the batch action bar, click COMPARE.
The comparison page opens in the DETAILS tab with the experiments compared side by side.
Modifying Experiment Selection
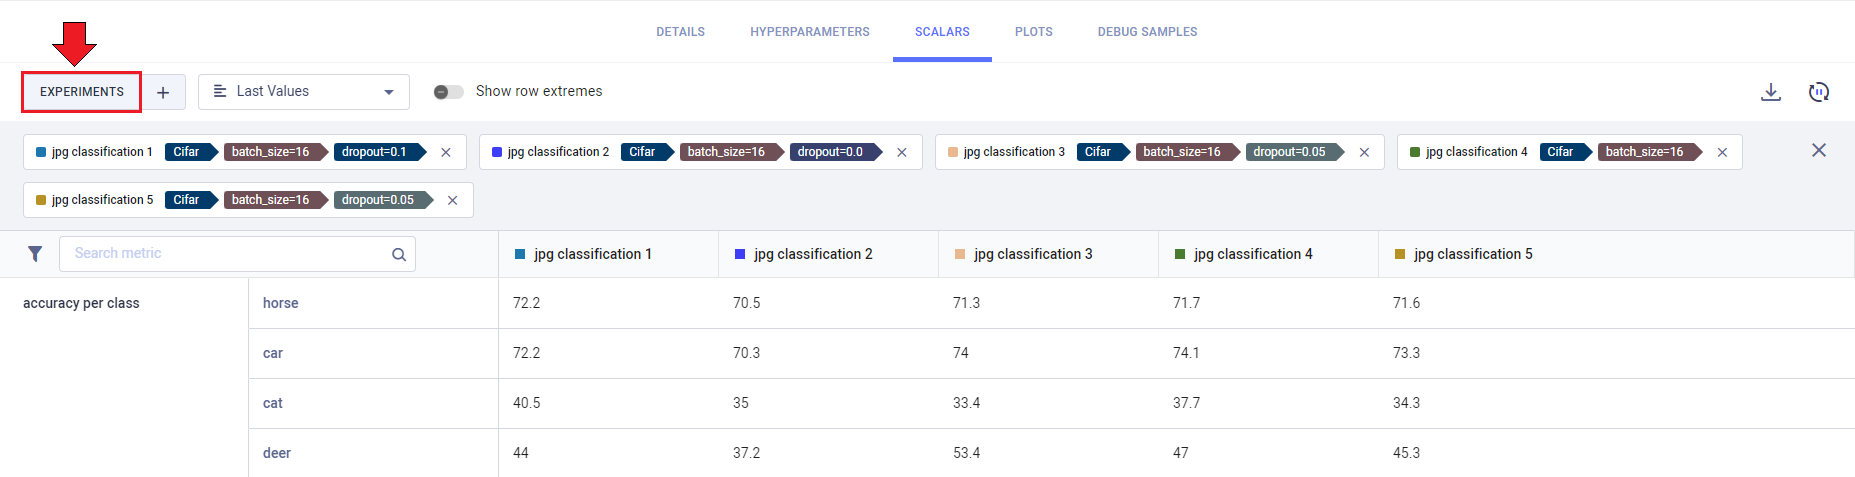
Click the EXPERIMENTS button to view your currently compared experiments. Click X on a listed experiment to remove
it from the comparison.
You can add/remove experiments to your comparison:
- Click the
+button in any of the comparison tabs. This opens up a window with an experiment table with the currently compared experiments at the top.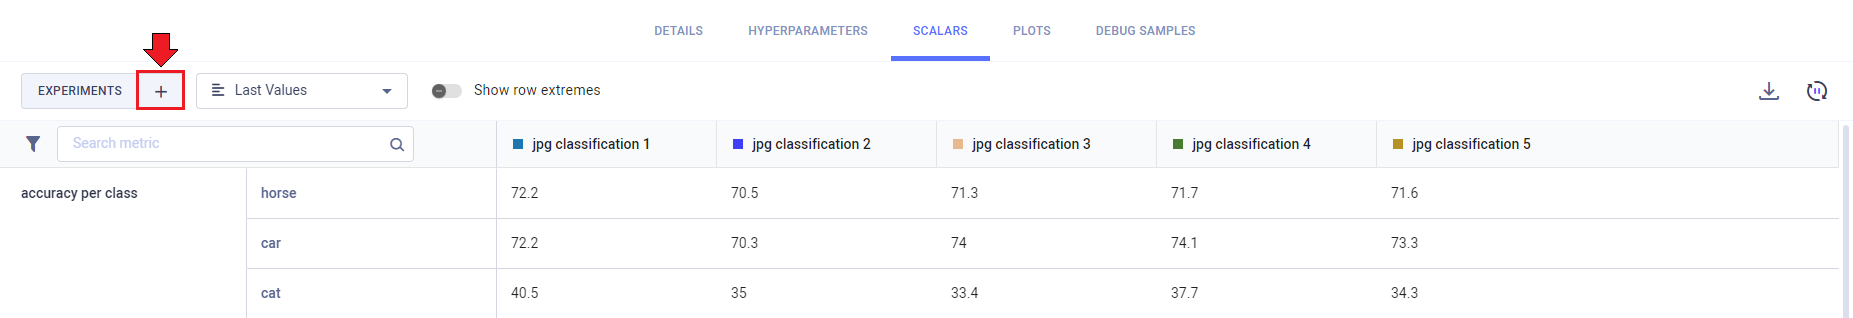
- Find the experiments to add by sorting and filtering the experiments with the appropriate column header controls. Alternatively, use the search bar to find experiments by name.
- Select experiments to include in the comparison (and/or clear the selection of any experiments you wish to remove).
- Click APPLY.
Sharing Comparison Page
To share a comparison page, copy the full URL from the address bar and send it to a teammate to collaborate. They will get the exact same page (including selected tabs etc.).
Embedding Comparison Visualization
To embed plots and debug samples from the comparison pages in your Reports, hover over the
resource and click ![]() ,
which will copy to clipboard the embed code to put in your Reports. These visualizations are updated live as the
experiments update. The Enterprise Plan and Hosted Service support embedding resources in external tools (e.g. Notion).
,
which will copy to clipboard the embed code to put in your Reports. These visualizations are updated live as the
experiments update. The Enterprise Plan and Hosted Service support embedding resources in external tools (e.g. Notion).
Comparison Modes
The comparison pages provide the following views:
- Side-by-side textual comparison
- Tabular scalar comparison
- Parallel coordinates for parameter impact on metric
- Scatter plot
- Overlaid plot comparison
- Side-by-side debug sample and plot comparison
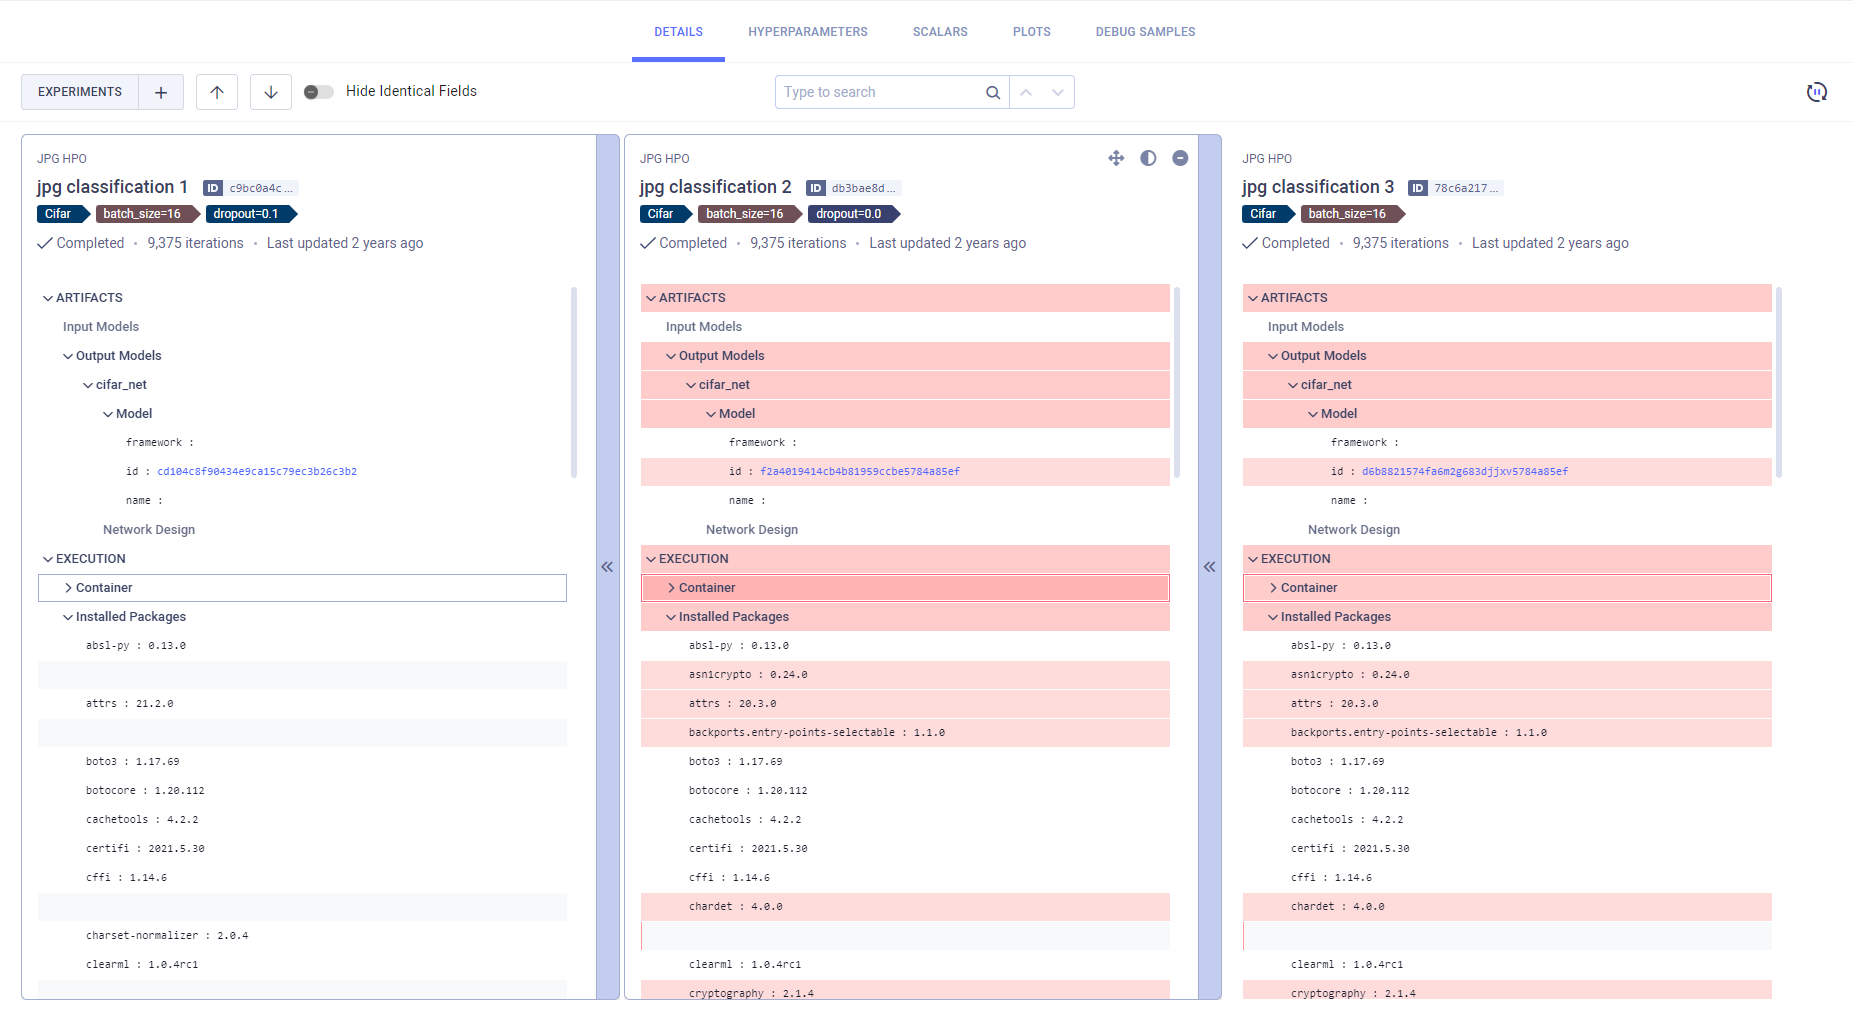
Side-by-side Textual Comparison
In the Details and Hyperparameters (Values view) tabs, you can view differences in the experiments' parameters' nominal values. The Details tab displays the experiments' execution details (source code, uncommitted changes, python packages), models, artifacts, configuration objects, and additional general information. Hyperparameters (Values view) displays the experiments' hyperparameter and their values.
The experiments are laid out in vertical cards, so each field is lined up side-by-side. The experiment on the left is used as the base experiment, to which the other experiments are compared. You can set a new base experiment in one of the following ways:
- Click on
 on the top right of the experiment that will be the new base.
 - Click on
 the new base experiment and drag it all the way to the left
The differences between the experiments are highlighted. Easily locate
value differences by clicking click ![]() (previous diff) or
(previous diff) or ![]() (next diff)
in the tab header. Obscure identical fields by switching on the Hide Identical Fields toggle.
(next diff)
in the tab header. Obscure identical fields by switching on the Hide Identical Fields toggle.
Use the search bar to find any field names or values. Lines that match the search query are highlighted, and you can navigate between search results.
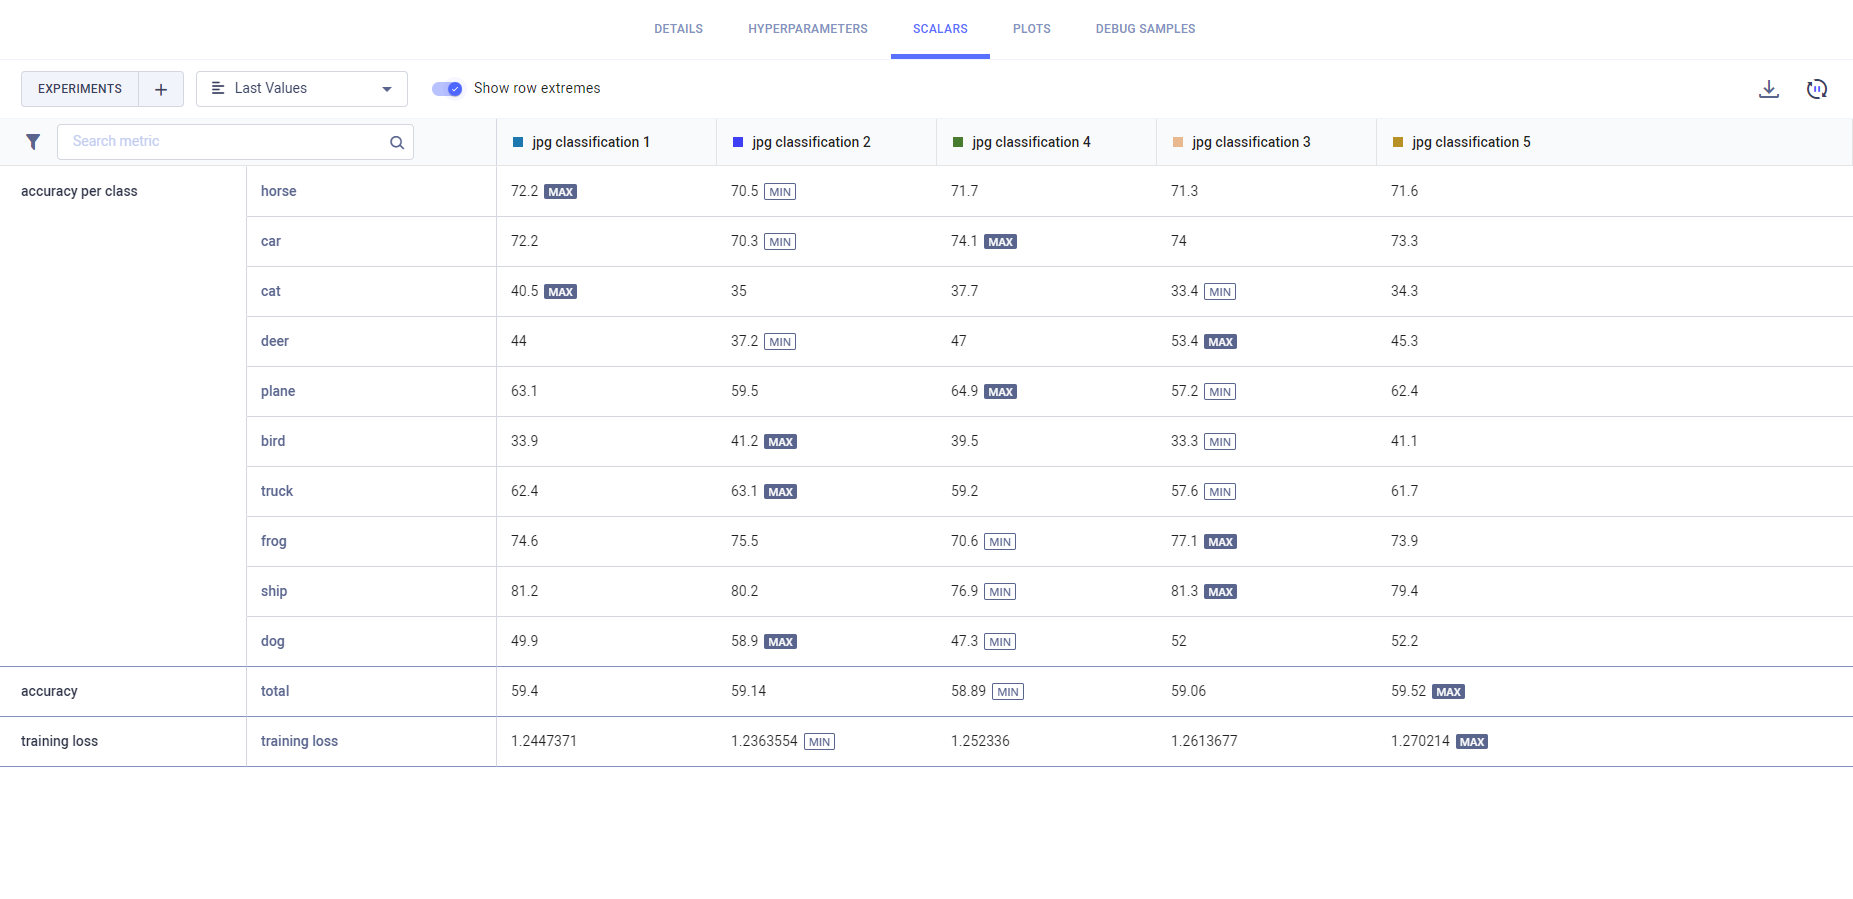
Tabular Scalar Comparison
The Scalars tab Values view lays out the experiments' metric values in a table: a row per metric/variant and a column for each experiment. Select from the dropdown menu which metric values to display:
- Last Values: The last reported values for each experiment
- Min Values: The minimal value reported throughout the experiment execution
- Max Values: The maximal value reported throughout the experiment execution
You can download the scalar comparison table as a CSV file by clicking ![]() .
.
Switch on the Show row extremes toggle to highlight each variant's maximum and minimum values.
Parallel Coordinates Mode
The Hyperparameters tab's Parallel Coordinates comparison shows experiments' hyperparameter impact on specified metrics:
- Under Performance Metrics, select metrics to compare for
- Select the values to use for each metric in the plot (can select multiple):
- LAST - The final value, or the most recent value, for currently running experiments
- MIN - Minimal value
- MAX - Maximal value
- In Parameters, select the hyperparameters to compare.
For example, plot the metric/variant accuracy/total against the hyperparameters
base_lr, dropout, and number_of_epochs.
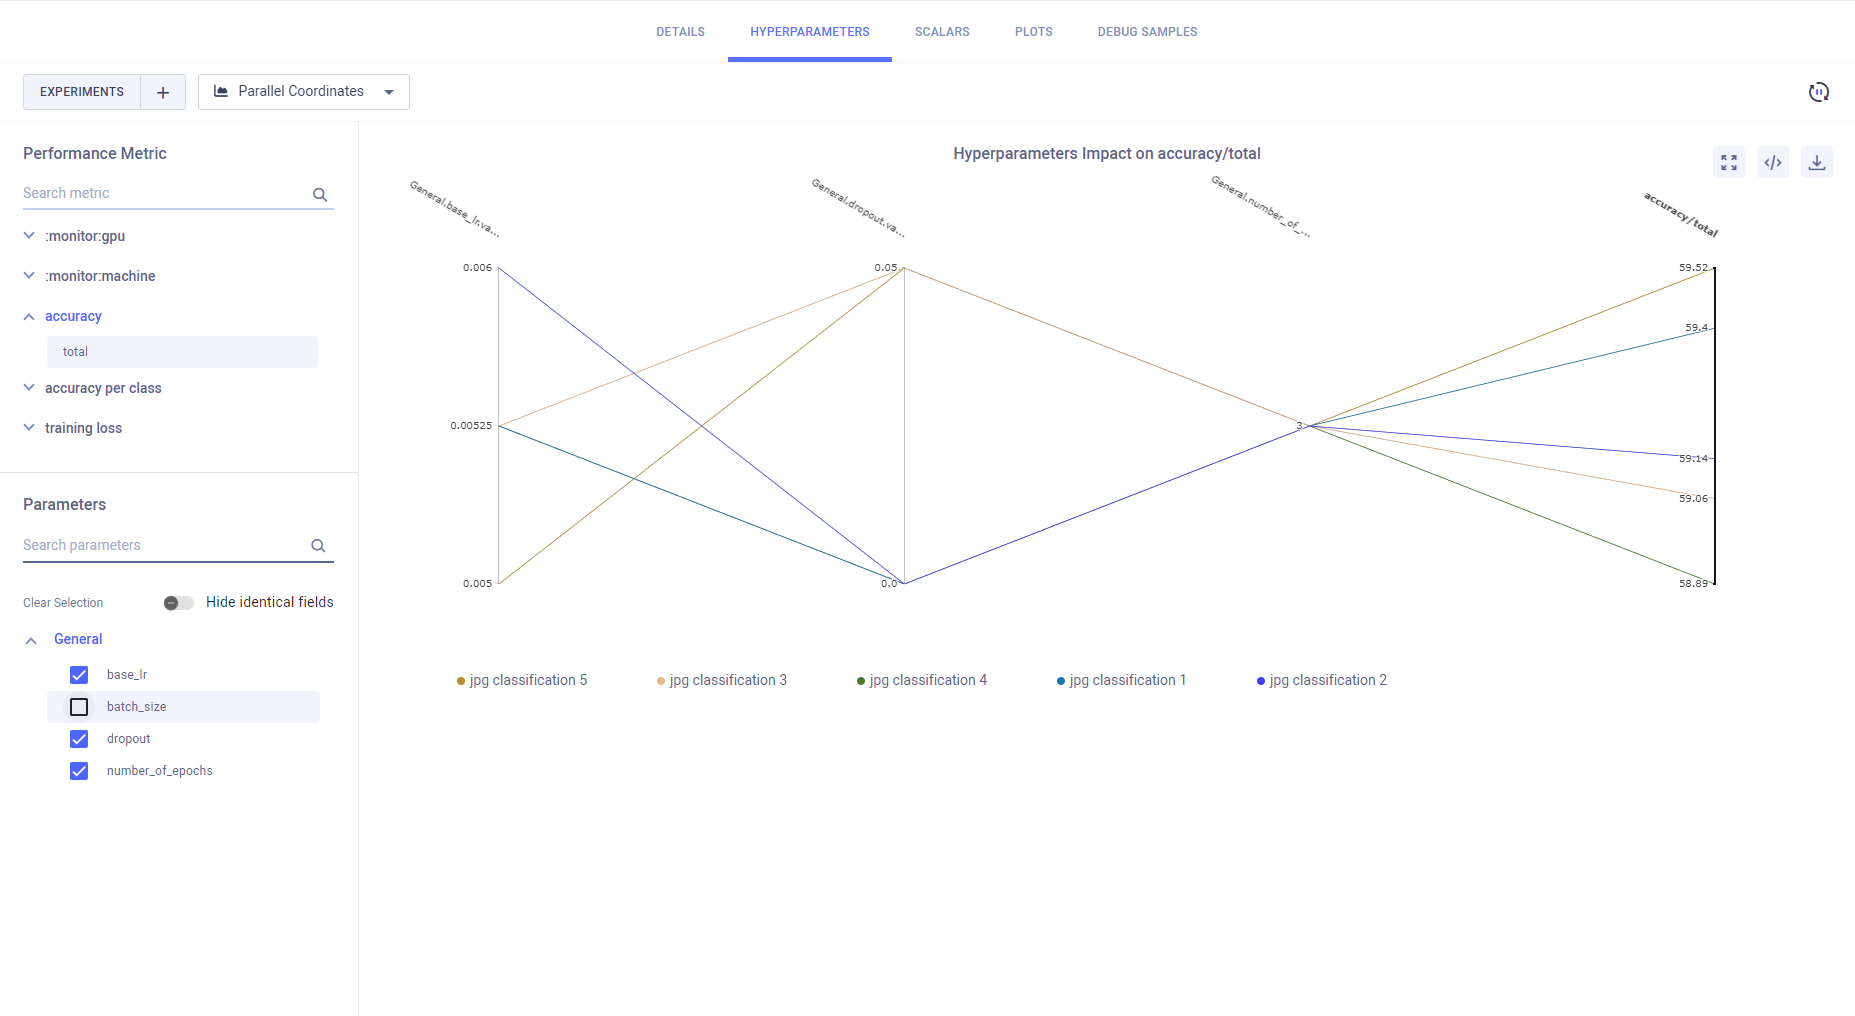
To focus on a specific experiment, hover over its name in the graph legend.
To hide an experiment, click its name in the graph legend (click again to bring back).
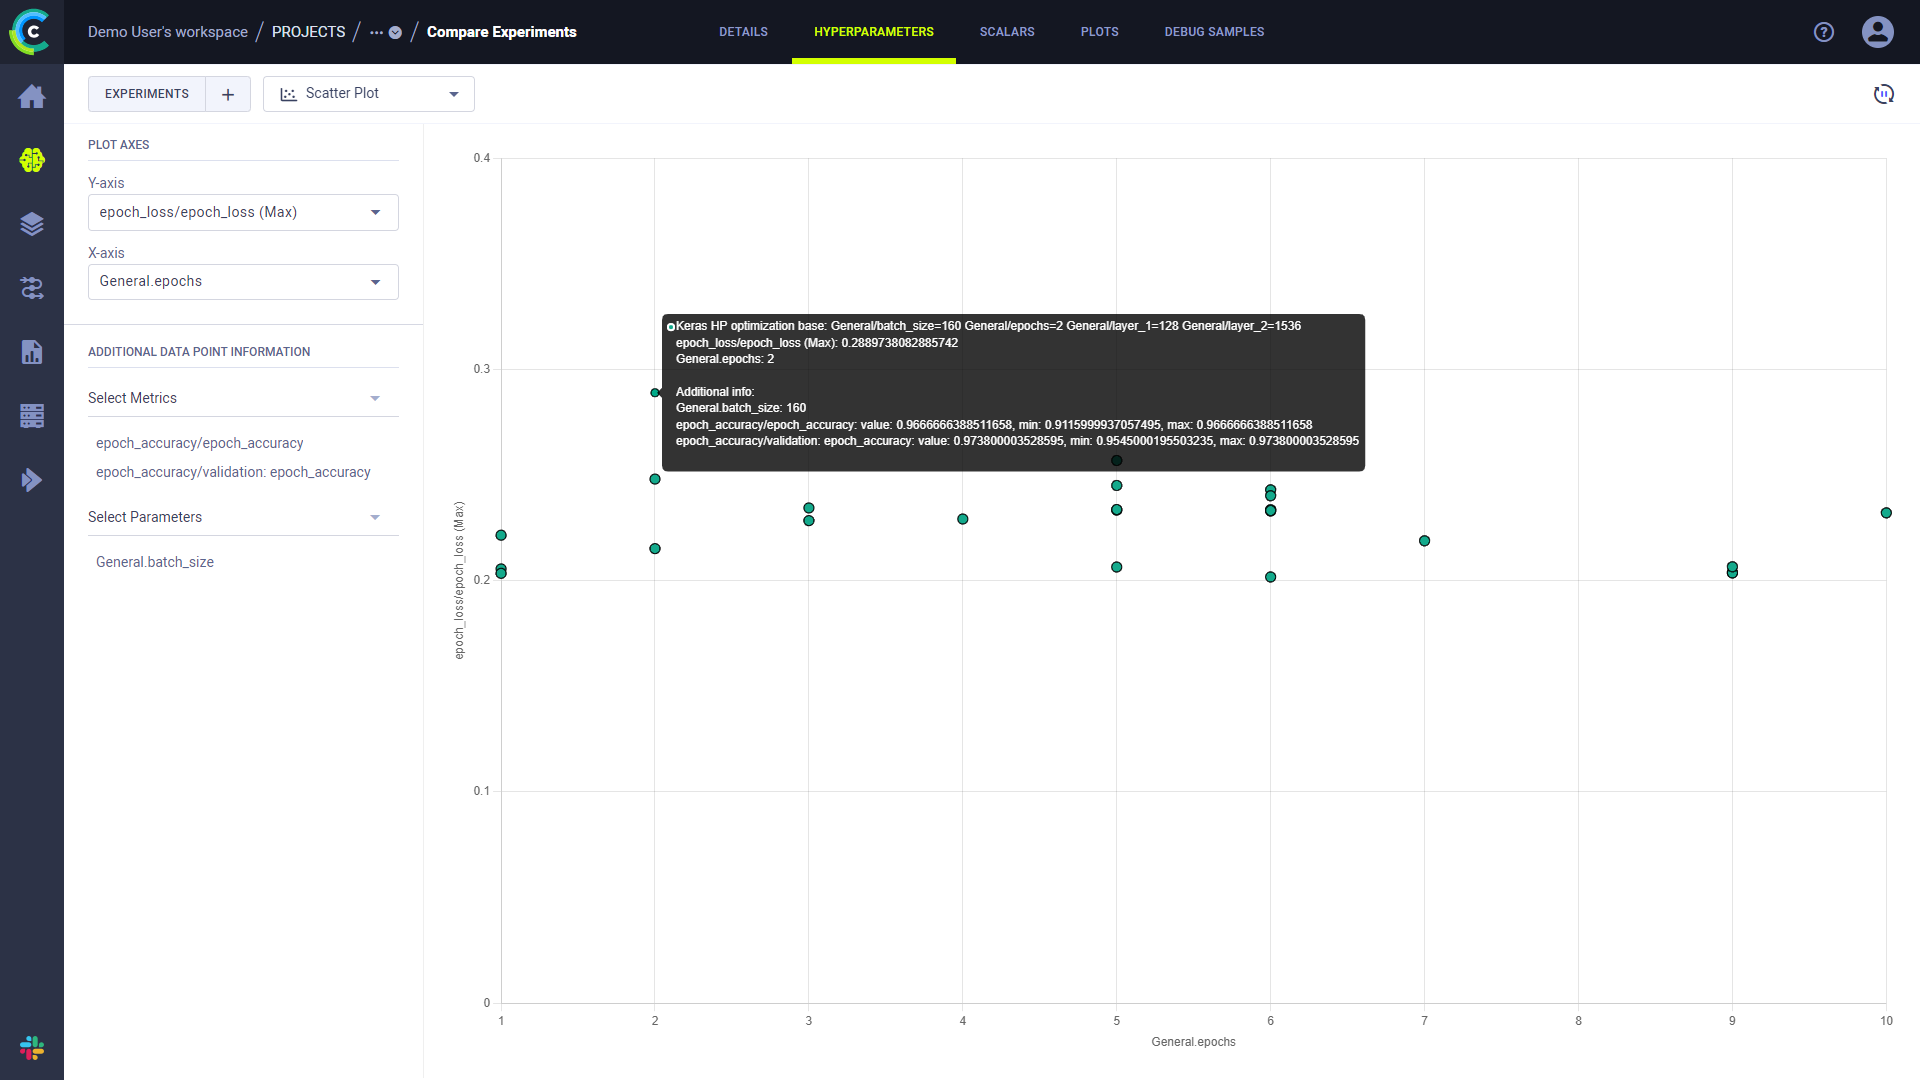
Scatter Plot
The Hyperparameters tab's Scatter Plot comparison shows experiments' correlation between a selected hyperparameter and metric.
To show the value distribution:
- Select the Plot Axes:
- Under Y-axis select the metric and the metric values to use in the plot:
- LAST - The final value, or the most recent value, for currently running experiments
- MIN - Minimal value
- MAX - Maximal value
- Under X-axis select the hyperparameter.
- Under Y-axis select the metric and the metric values to use in the plot:
Hovering over each datapoint in the resulting plot will show the experiment name and the metric and parameter value for that point. You can add additional metrics and hyperparameters values to the datapoint tooltip through ADDITIONAL DATA POINT INFORMATION.
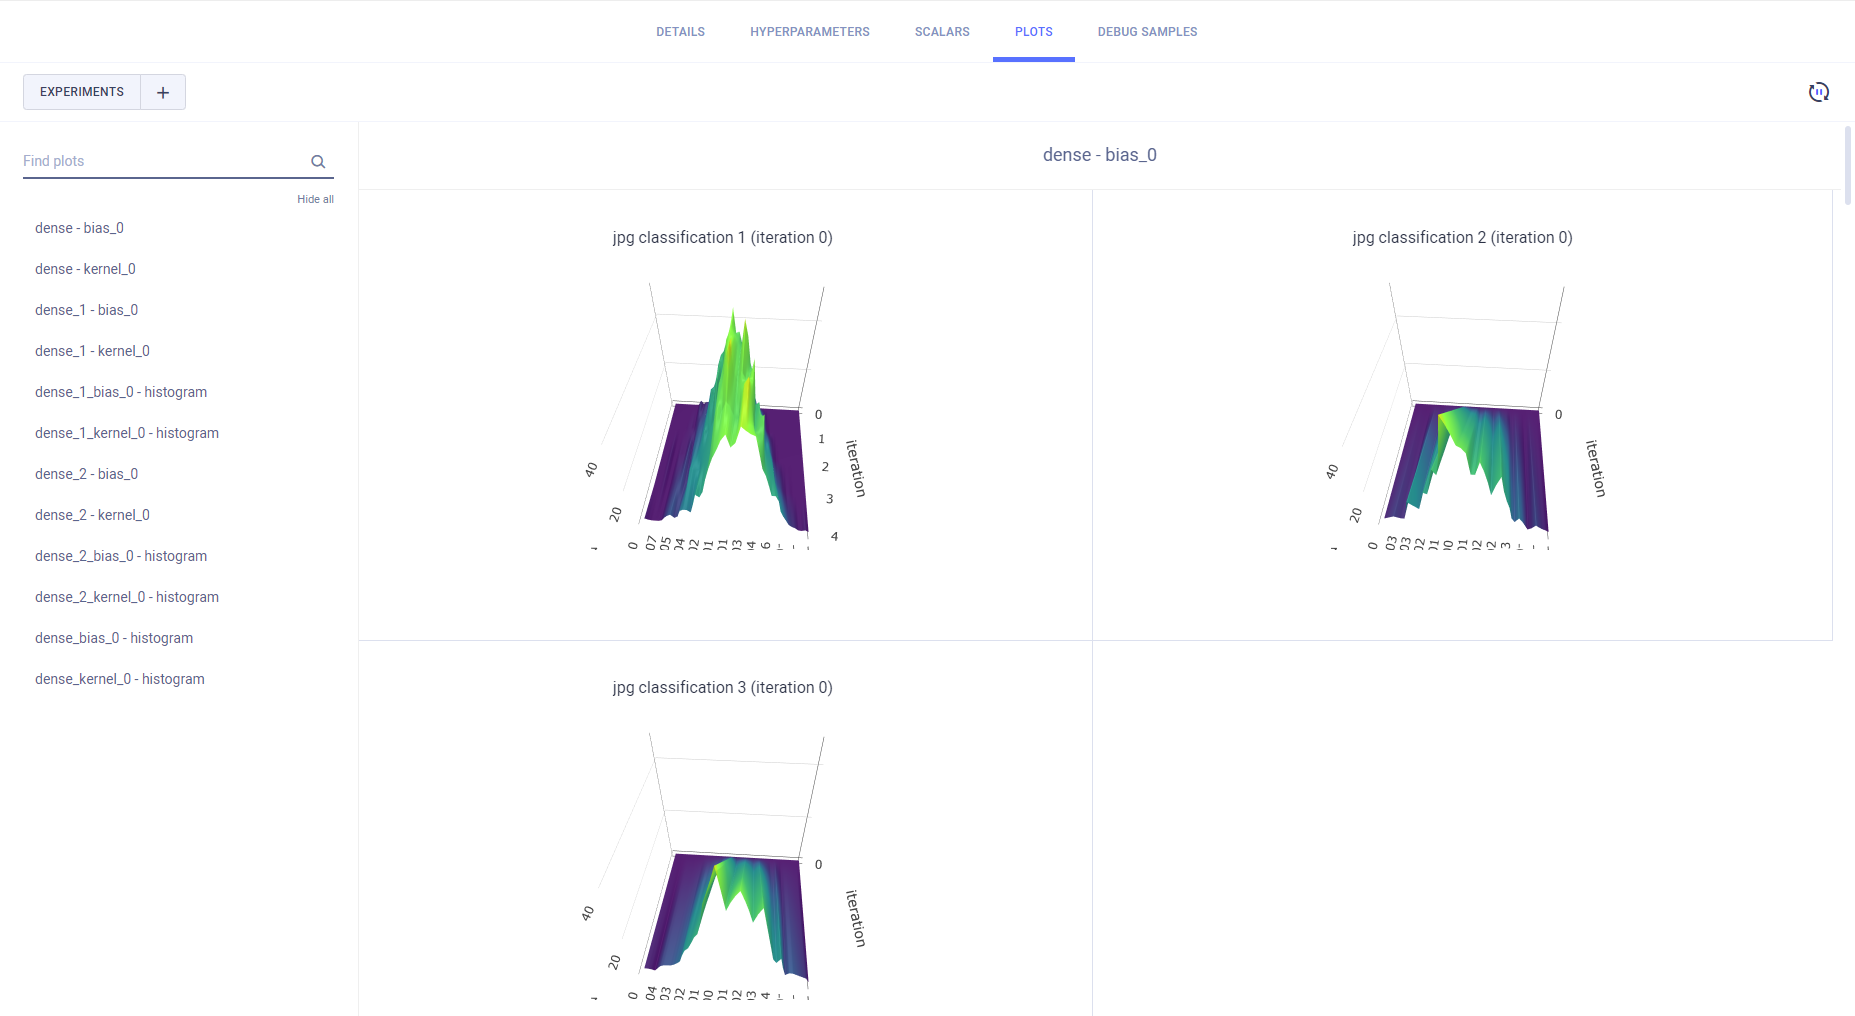
Plot Comparison
The Scalars (Graph view) and Plots tabs compare experiments' plots.
The Scalars tab displays scalar values as time series line charts. The Plots tab compares the last reported iteration sample of each metric/variant combination per compared experiment.
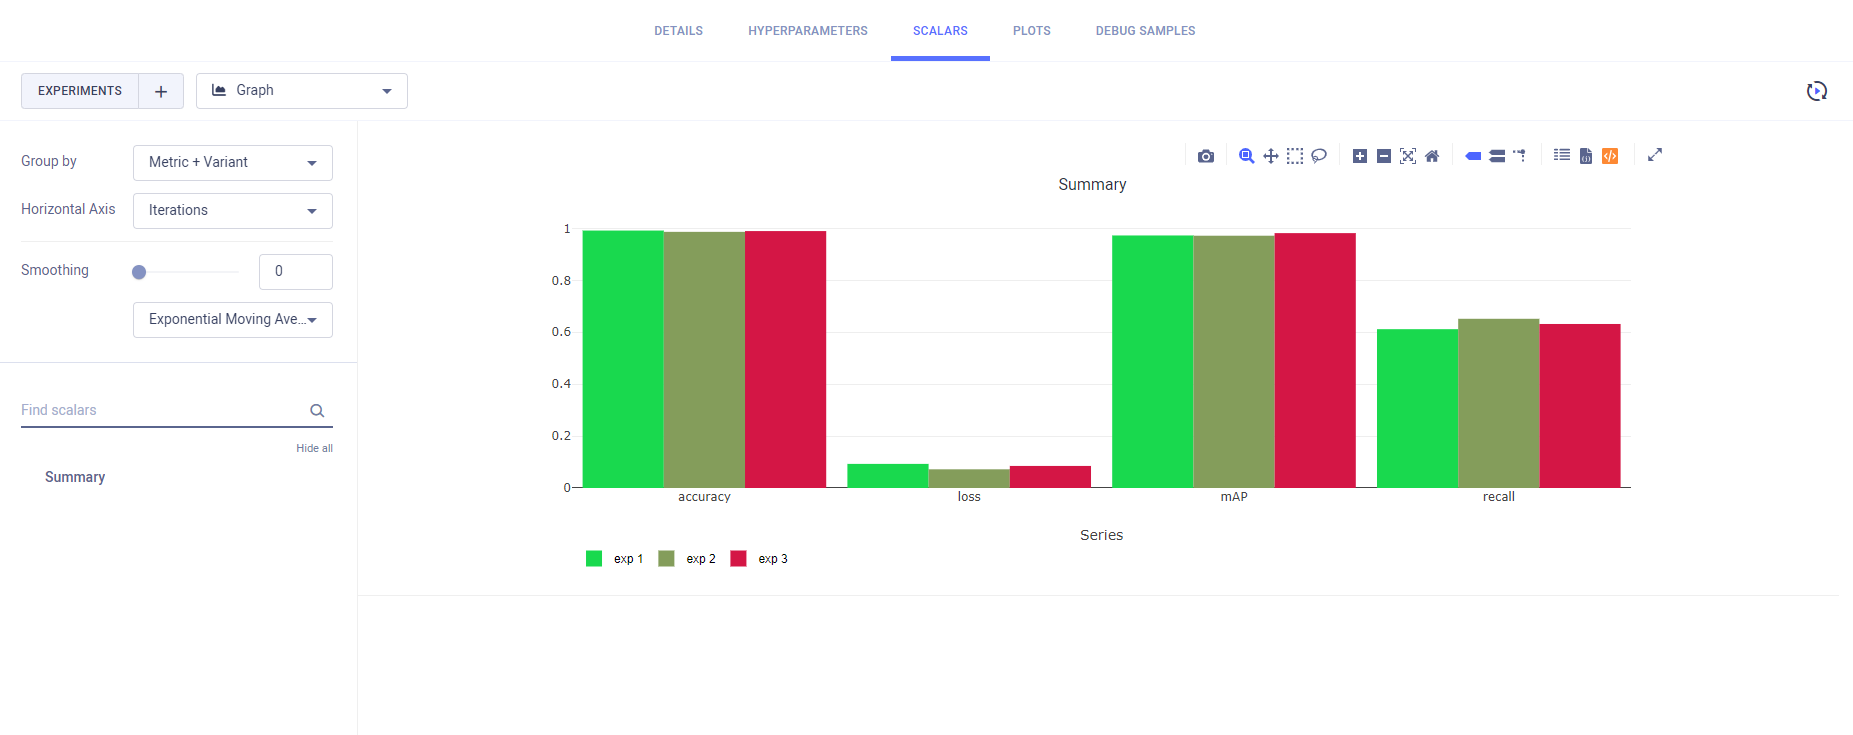
Line, scatter, and bar graphs are compared by overlaying each metric/variant from all compared experiments' into a single comparative plot.
Use Group by to select how to group plots:
- Metric - All variants for a metric appear on the same plot.
- Metric+Variant (default) - Every variant appears on its own plot.
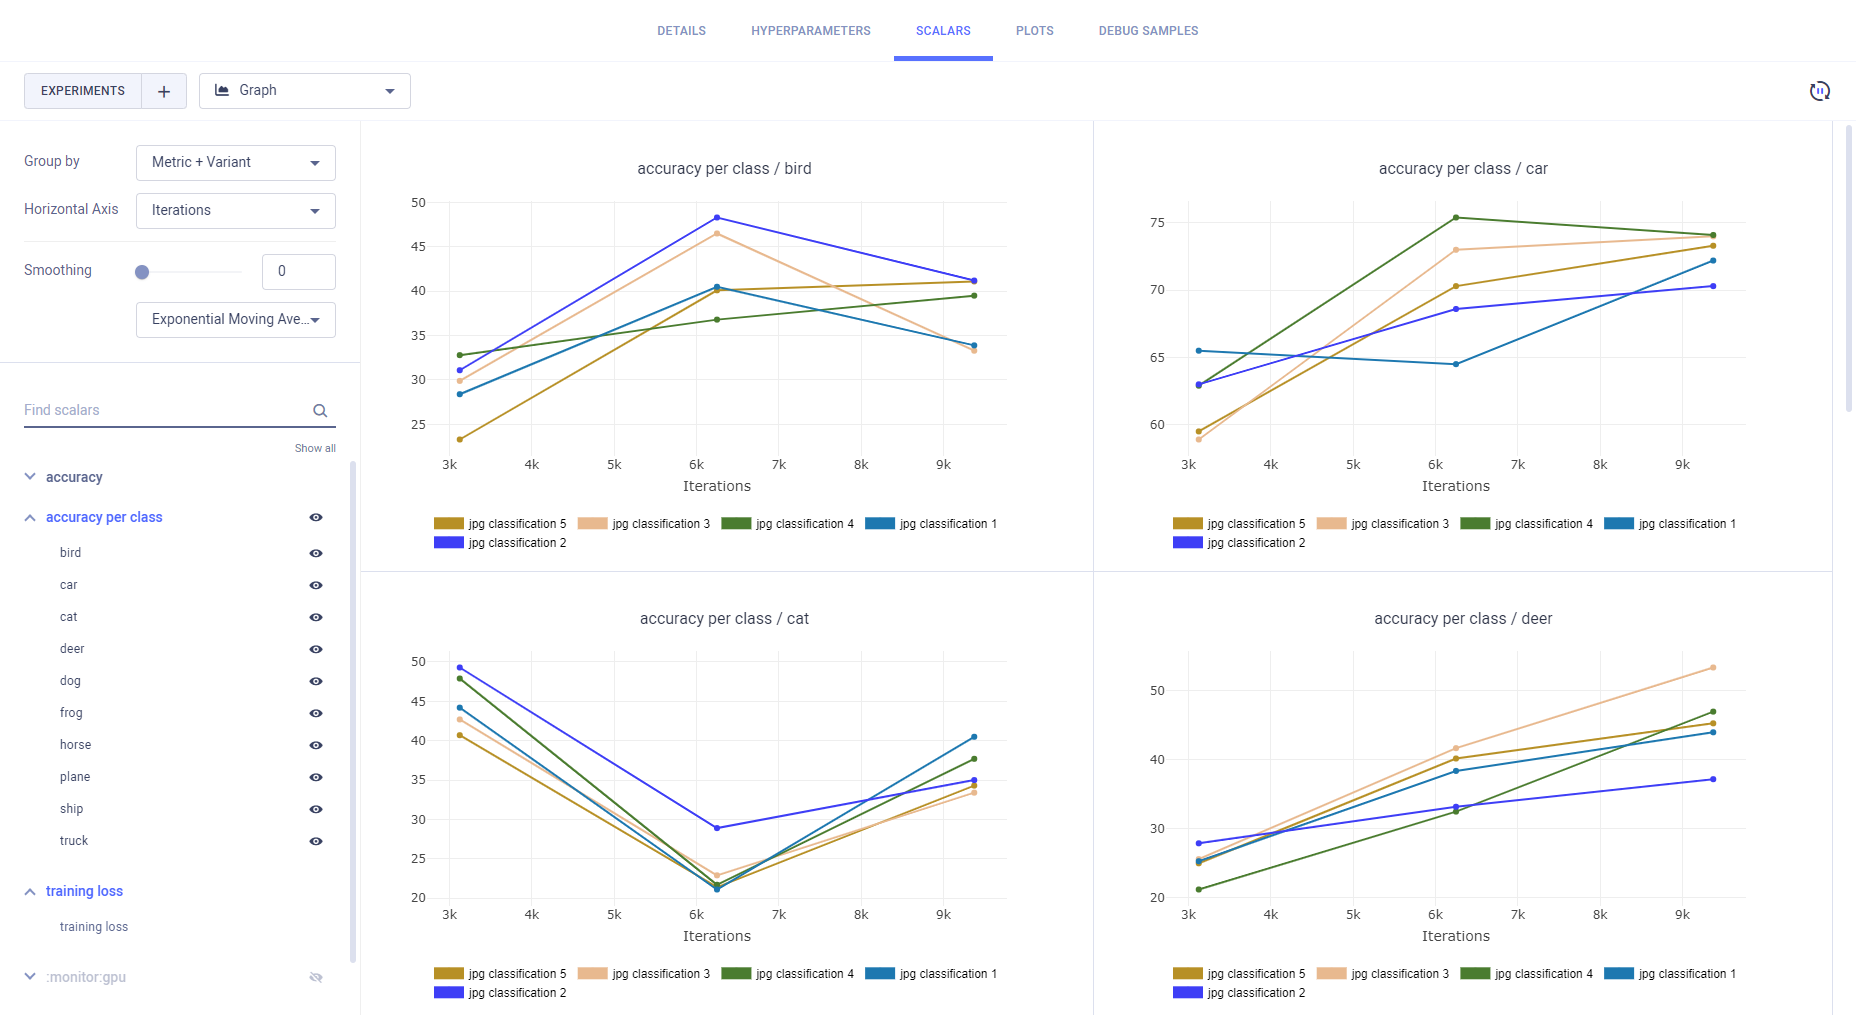
Other plot types are displayed separately for each experiment.
All single value scalars are plotted into a single clustered bar chart under the "Summary" title, where each cluster represents a reported metric, and each bar in the cluster represents an experiment.
Hover over plots to access plot controls (see Scalar Plot Tools).
Side-by-side Debug Sample Comparison
Compare debug samples at different iterations to examine how your experiments perform throughout their execution.
You can view debug samples by metric in the reported iterations. Filter the samples by metric
by selecting a metric from the dropdown menu above the samples. The most recent iteration appears first. To navigate
between iterations, click ![]() (older images),
(older images),
Click ![]() in order
to synchronize iteration and metric selection across experiments. For example, if you select a metric for one
experiment's debug samples, the same metric will be automatically selected for the rest of the experiments in the
comparison.
in order
to synchronize iteration and metric selection across experiments. For example, if you select a metric for one
experiment's debug samples, the same metric will be automatically selected for the rest of the experiments in the
comparison.
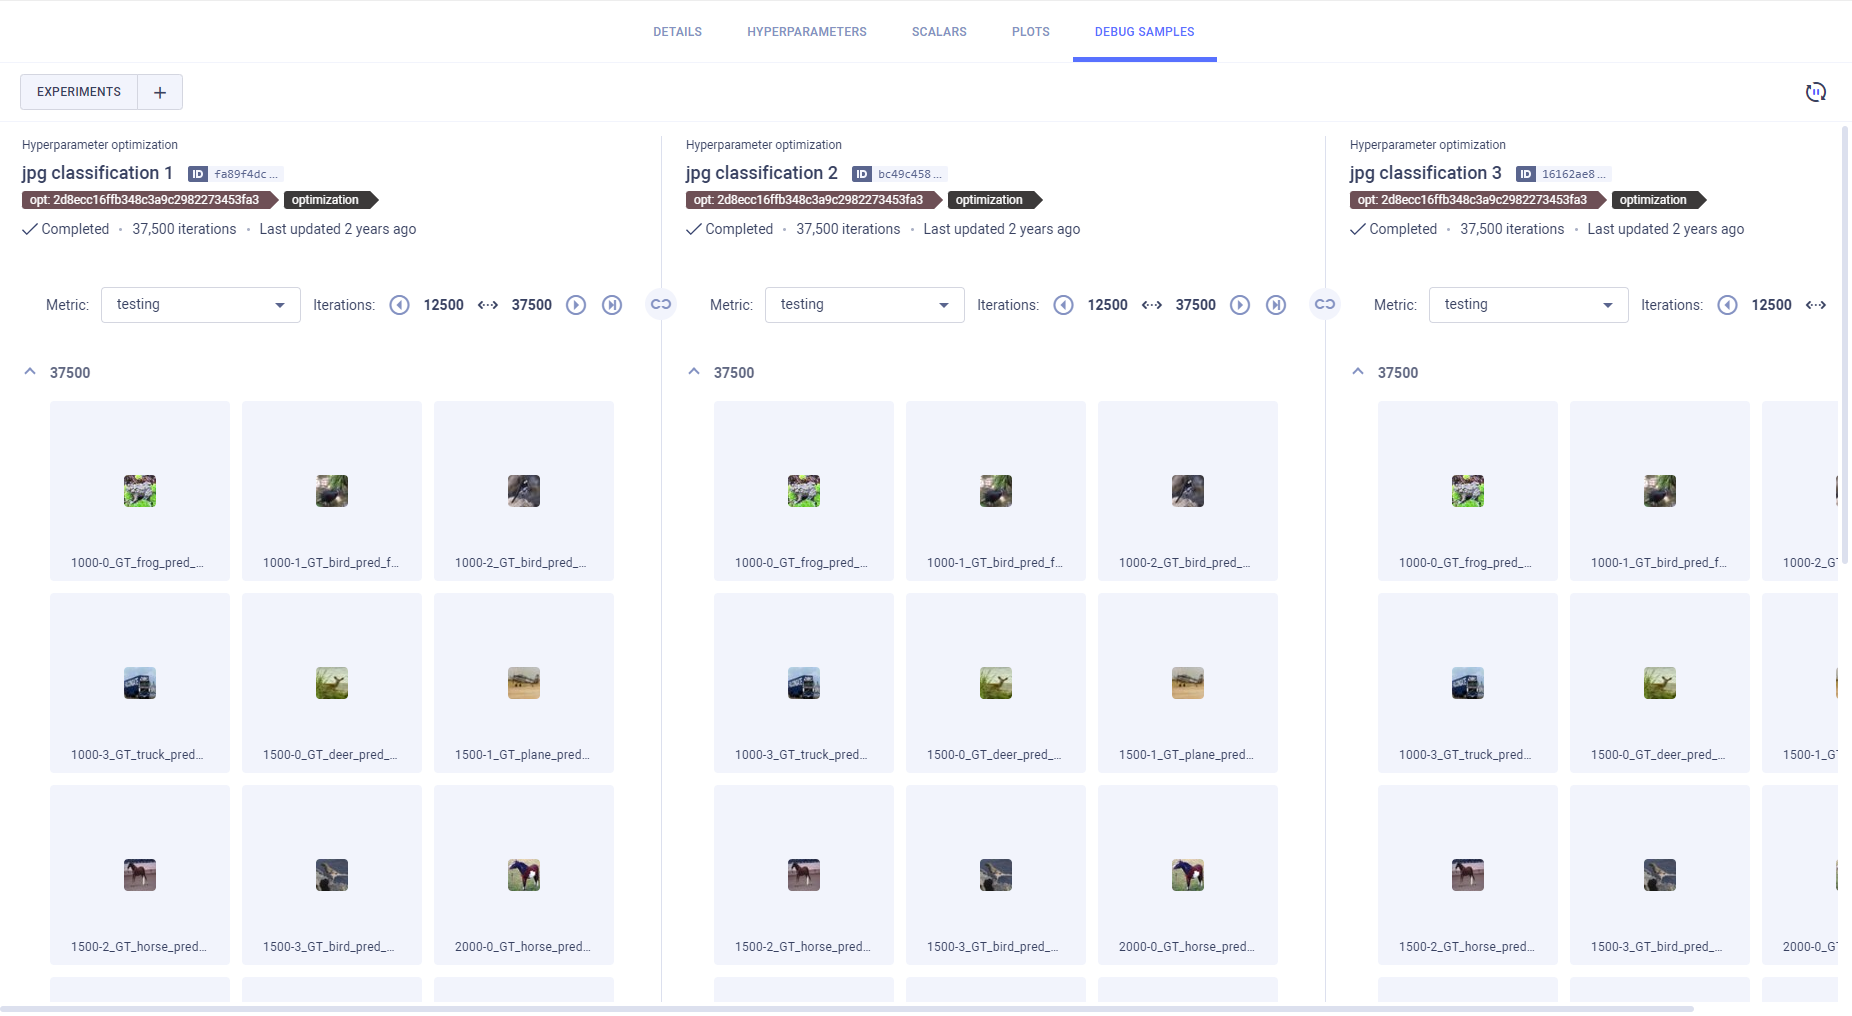
Open a debug sample (image, audio, or video) in the viewer or player, by clicking the thumbnail.
![]()
To move to the same sample in another iteration, click ![]() (previous),
(previous), ![]() (next), or move the slider.
(next), or move the slider.