Plotly Reporting
The plotly_reporting.py example demonstrates ClearML's Plotly integration and reporting.
Report Plotly plots in ClearML by calling the Logger.report_plotly method, and passing a complex
Plotly figure, using the figure parameter.
In this example, the Plotly figure is created using plotly.express.scatter (see the Plotly documentation):
# Iris dataset
df = px.data.iris()

# create complex plotly figure
fig = px.scatter(
    df,
    x="sepal_width",
    y="sepal_length",
    color="species",
    marginal_y="rug",
    marginal_x="histogram"
)

# report the plotly figure
task.get_logger().report_plotly(
    title="iris", series="sepal", iteration=0, figure=fig
)
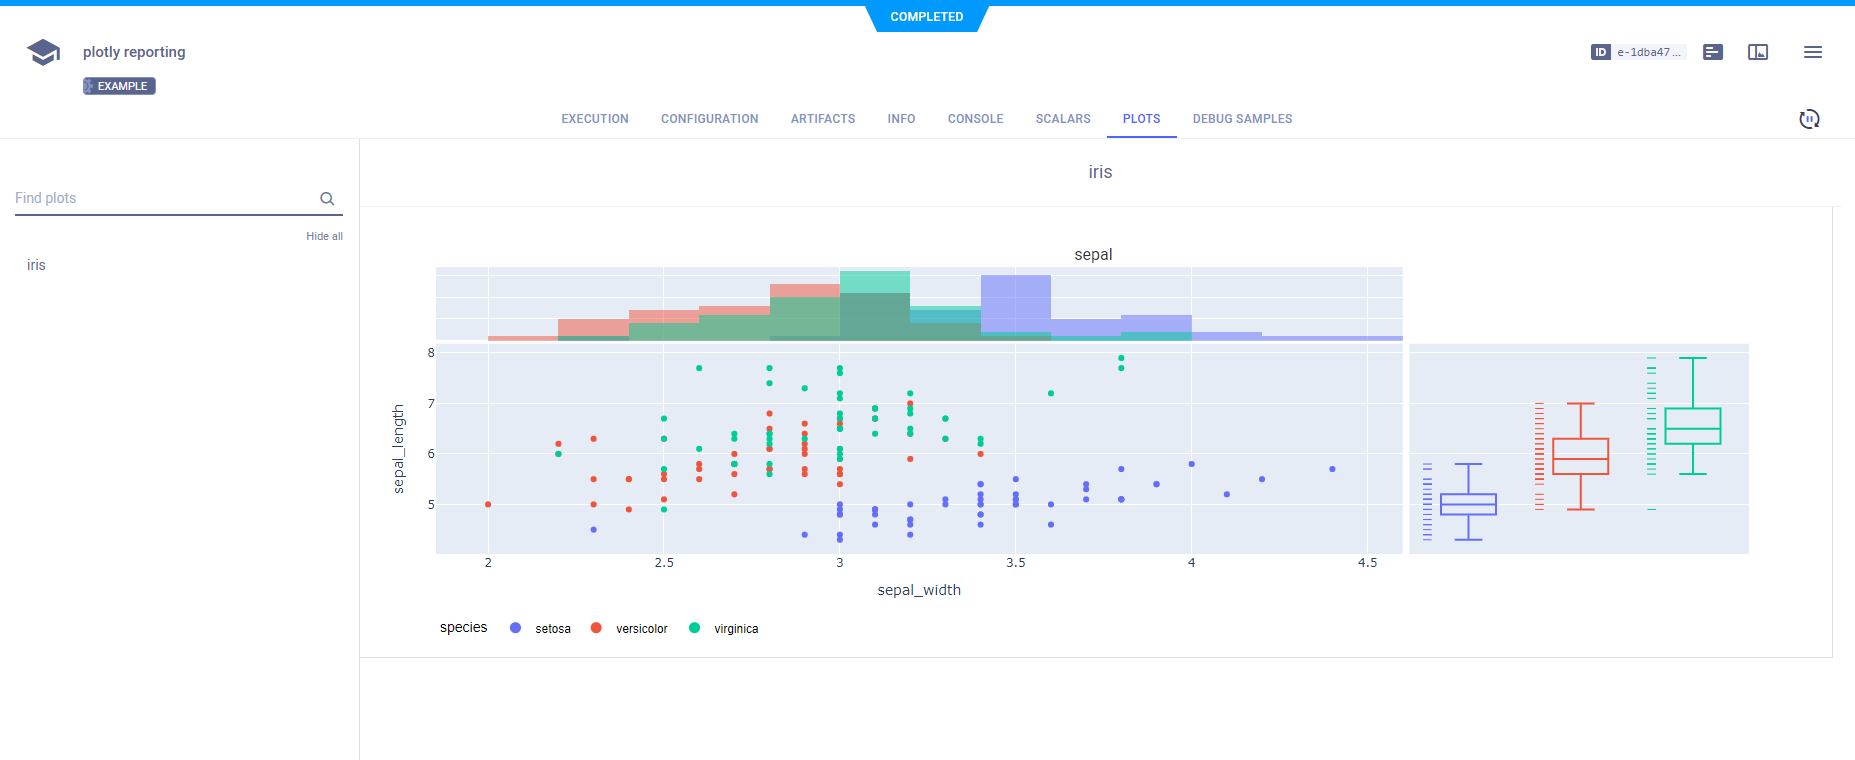
When the script runs, it creates an experiment named plotly reporting in the examples project.
ClearML reports Plotly figures, and displays them in the ClearML Web UI > experiment details > PLOTS tab.