By Victor Sonck, Developer Advocate at ClearML
Reporting your findings to colleagues, managers, or even your future self is a core component of any modern ML workflow. Having one central place where you can easily build a summary of your work makes it that much easier.
That’s where ClearML Reports come in. They are easy to build, connect seamlessly with existing ClearML functionality and are based on markdown, so they’re very easy to export or connect to an external reporting tool such as Confluence, Monday.com, and Notion, for example.
Prefer to watch the video? Click below:
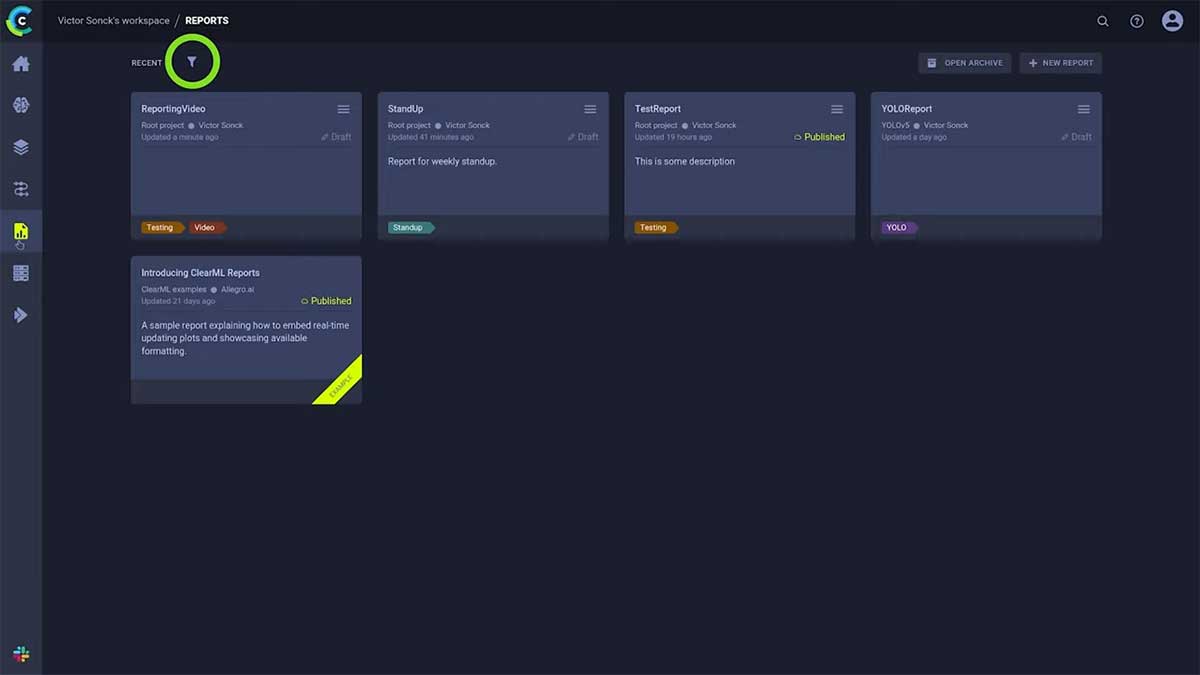
You can find the Reports page under this icon in the sidebar:
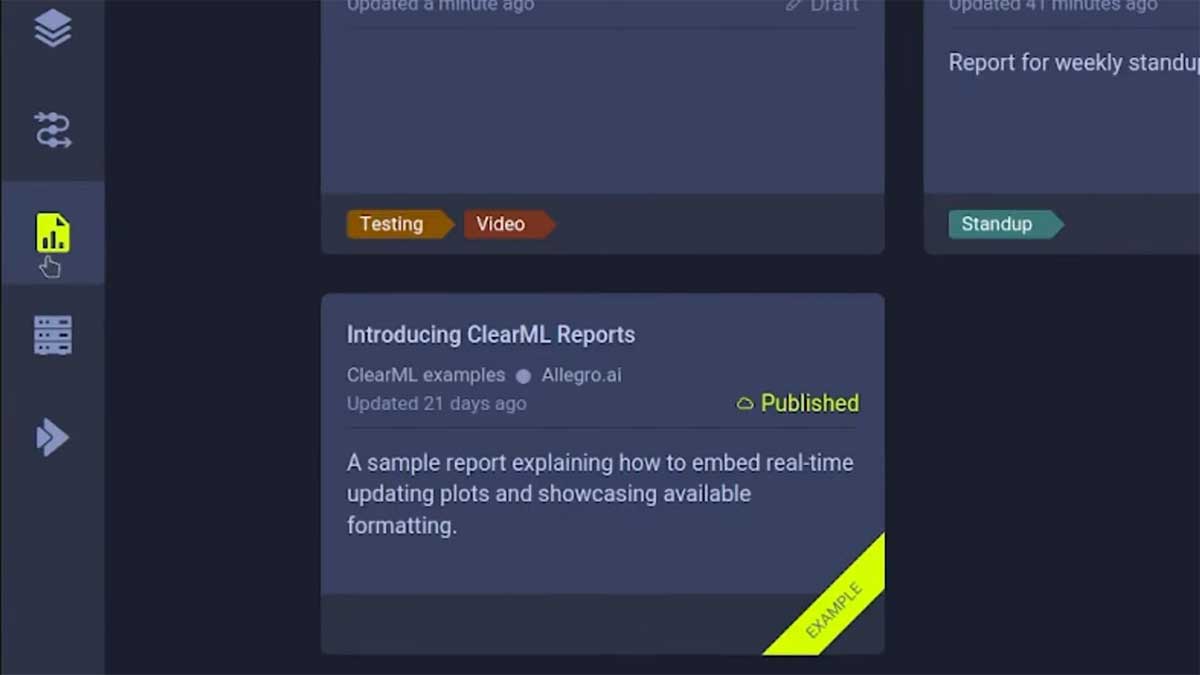
This will bring you to an overview page that’s very similar to the ClearML Datasets page. Each block here is a single report and you can filter them on tags or archive them just like datasets or experiments:
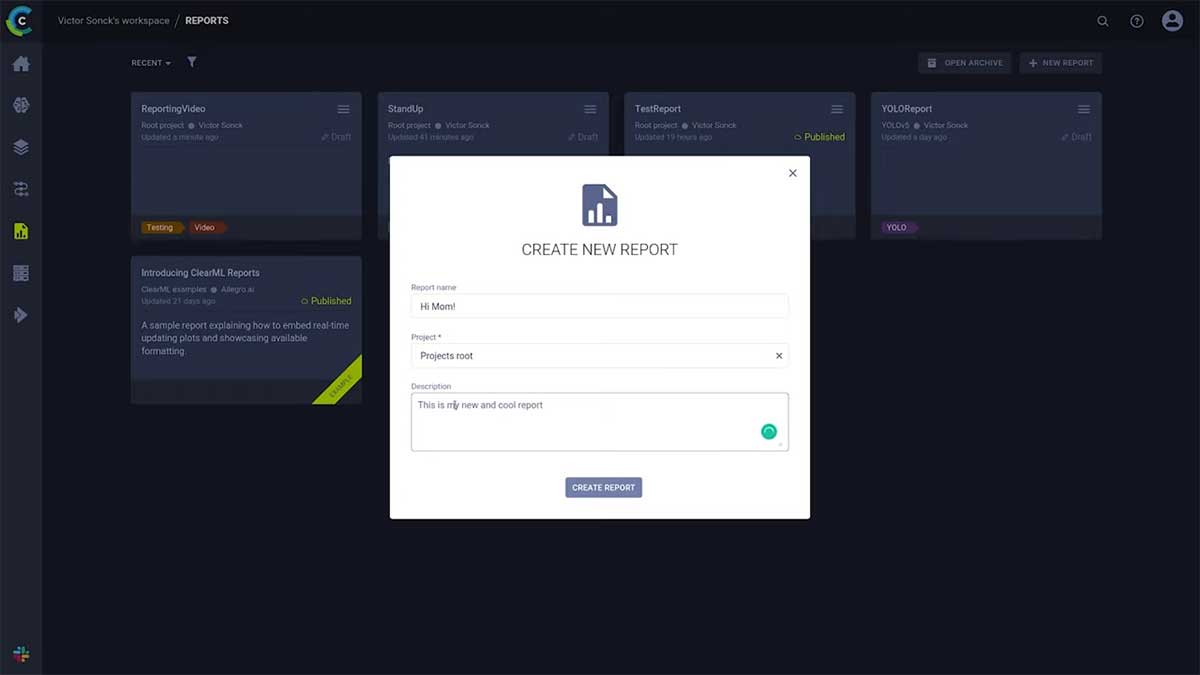
To create a new report, simply click a button, and give it a name and an optional description:
Let’s leave the project on the default setting and create the report. Now we get our first look at the editor page. You can click open the description from here, use it to create a brief summary of the report that is shown in the main page. It’s also worth noting that reports are searchable based on the description, so it does pay off to fill it in:
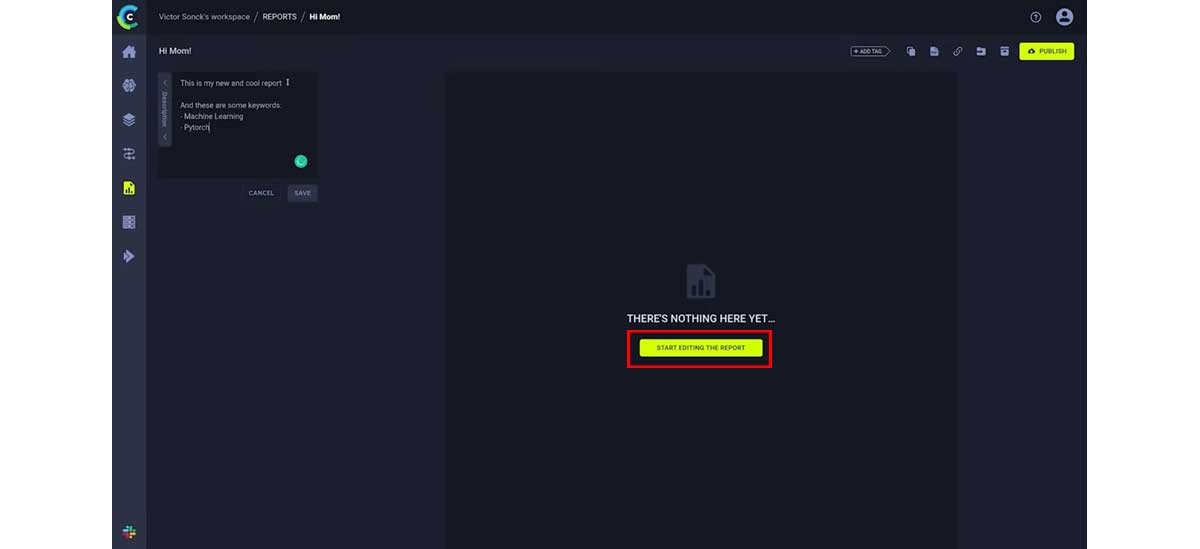
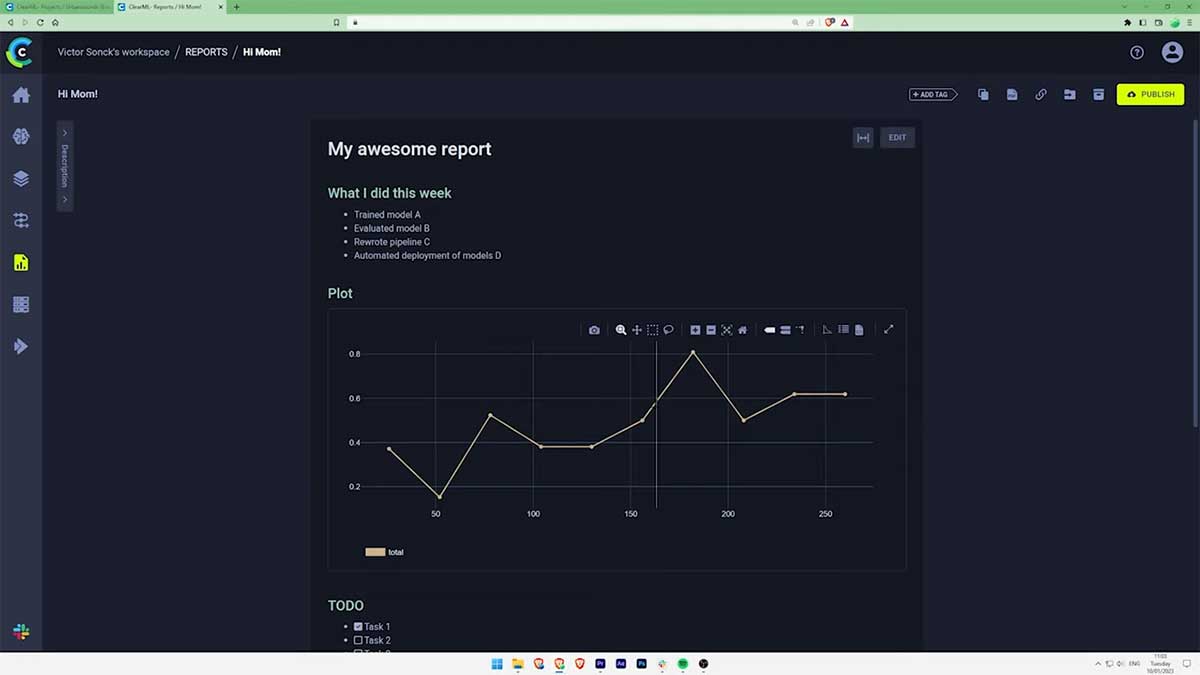
The report itself will by default always be presented in read mode. To start editing, just click the button highlighted in red above, and you’ll be presented with 2 sections: the markdown section and the preview.
Everything you write in markdown on the left, will be rendered on the right. All the normal markdown features work, like headings, images, or checkmarks.
We also included a markdown cheat sheet at the bottom here:
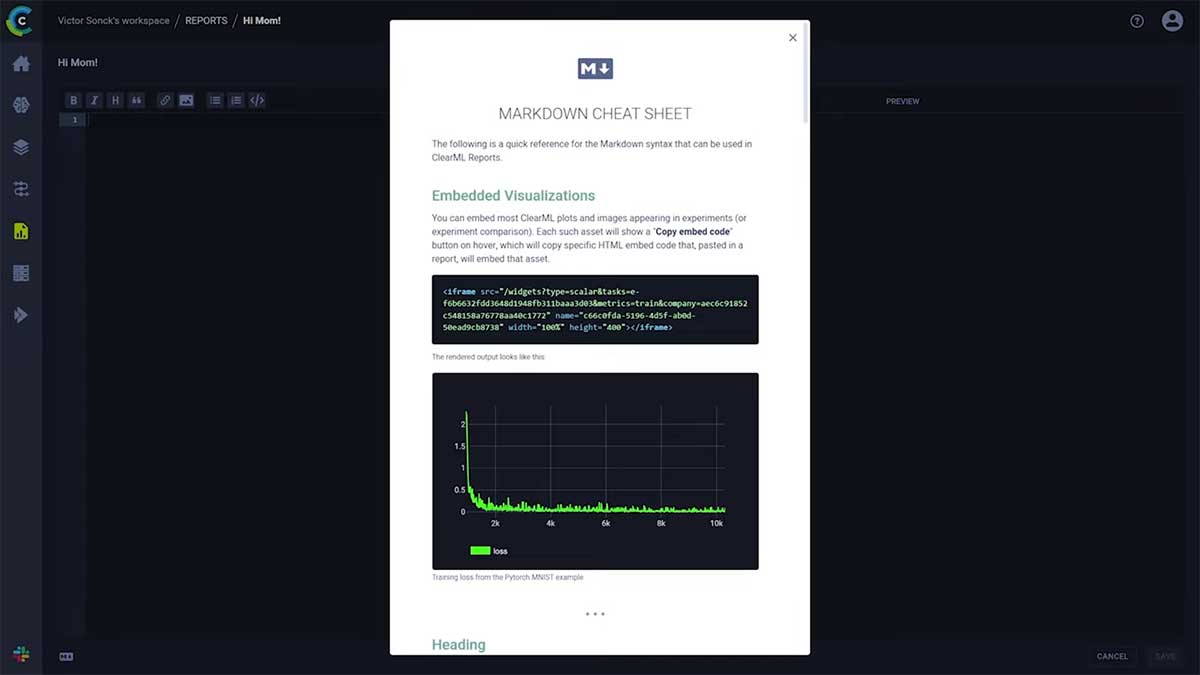
It will help you get started with markdown very quickly and even as a markdown veteran, it can often come in handy.
Let’s create our report structure using the markdown editor, by adding some titles, subtitles, text and code. A table here and a to-do list there, thanks to the power of markdown, it’s very easy to quickly create a nicely formatted report from simple plaintext:
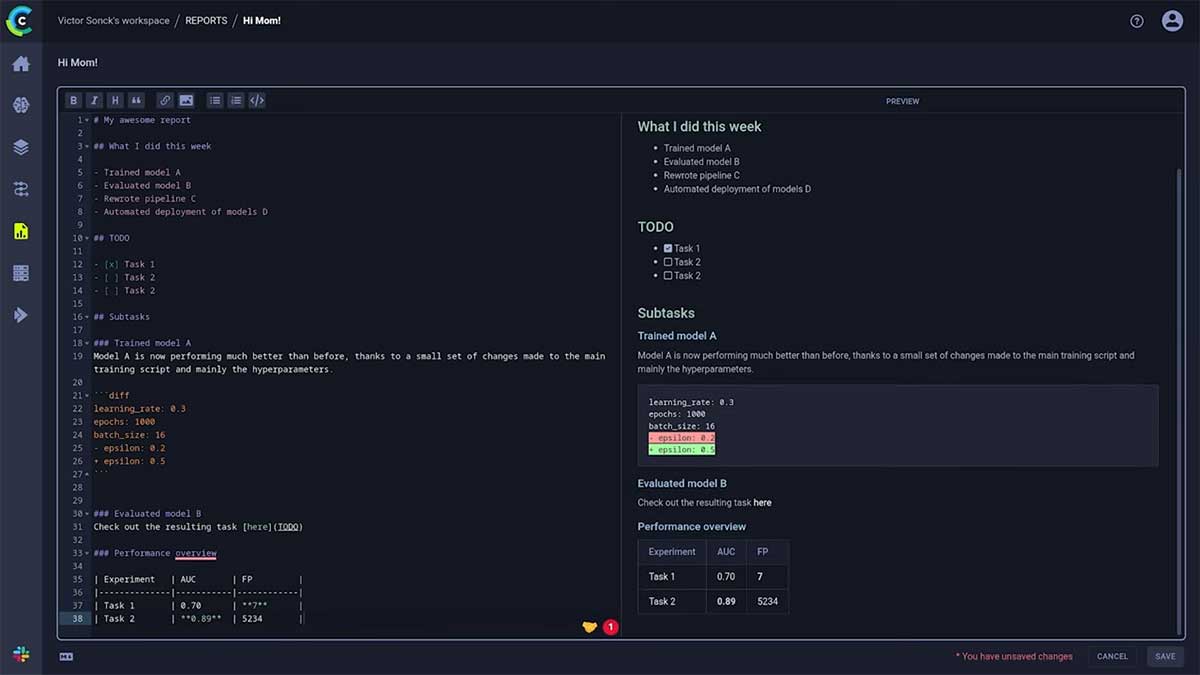
Don’t forget to click save!
But there are several things missing; we want to be able to show scalars, debug samples and plots too.
Adding Assets from the Experiment Manager
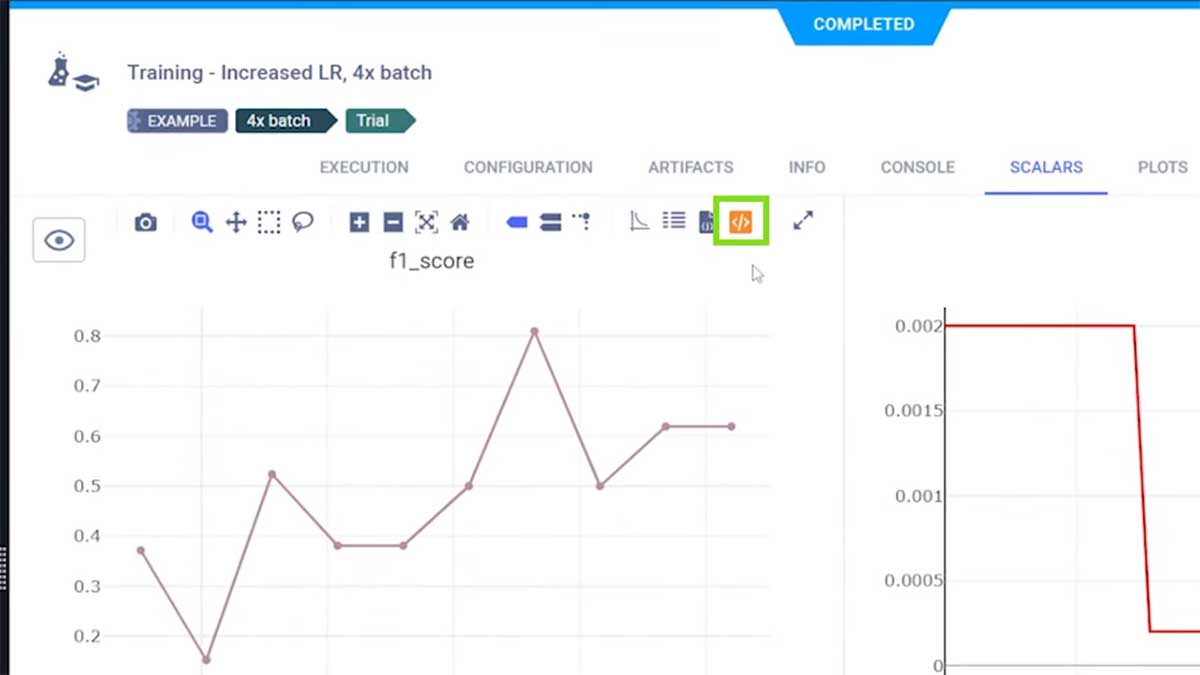
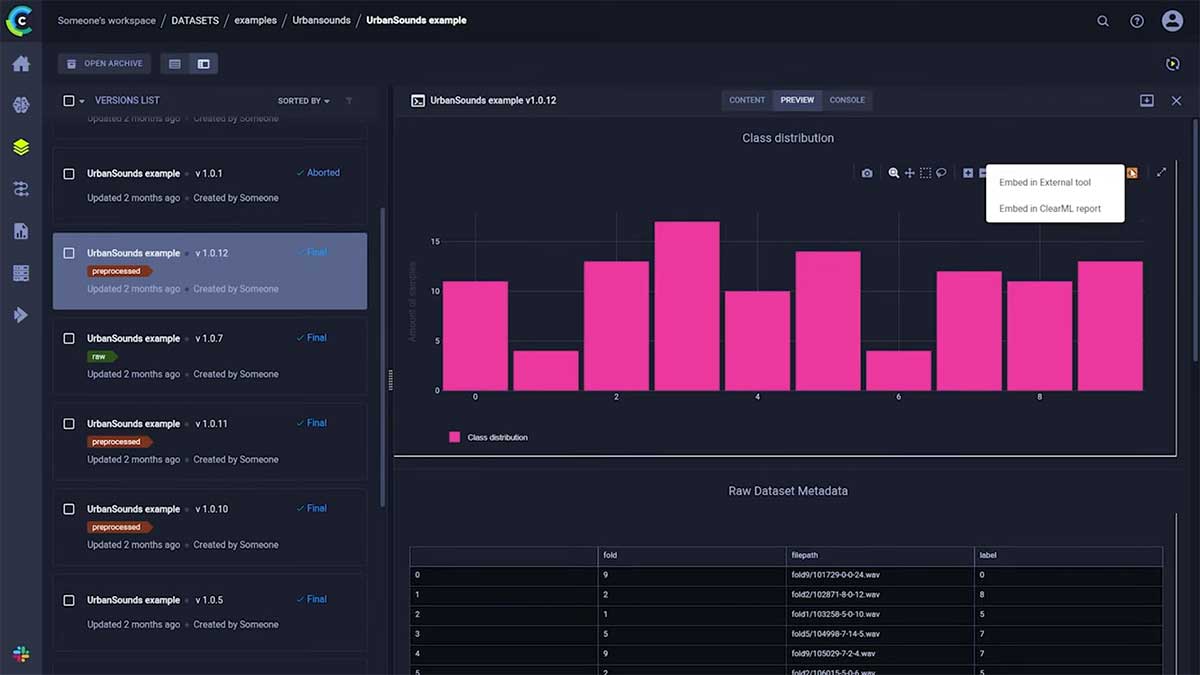
When you go into the Experiment Manager, click open a task, and navigate to the scalars, plots, or debug samples, you’ll notice this button (highlighted in green below) when hovering over an element:
Clicking that button will give you 2 options:
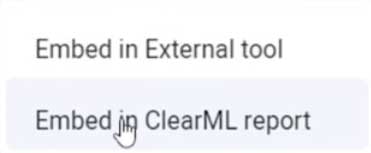
We want to embed the plot in our new ClearML report, so we’ll choose this option.
You can now go back to your report and paste what you just copied right into the markdown editor:
You’ll immediately see the preview update, embedding your fully interactive plot into the report; it’s that simple!
Now you can go around through your experiments and collect various assets you want to add to your report. Don’t forget ClearML is integrated, so you can also embed descriptive statistics of your datasets for example! Even when you are comparing multiple experiments, you can go to the plots section and include the comparison graphs as well!
It’s important to realize that this is not just an HTML export of the interactive plot, as the plot is still connected to the backend. So when new data comes in, it will be visible after a reload of the report!
Once your report is done, you can share a link to the report. Publishing the report will make it read-only, so it can be used by your colleagues as a source of truth.
Third-Party Embeds
Want to use your results in Confluence? No problem! Go to the element you want to insert, but this time, click the “Embed in external tool” option (please note this option is not available in our self-hosted version):
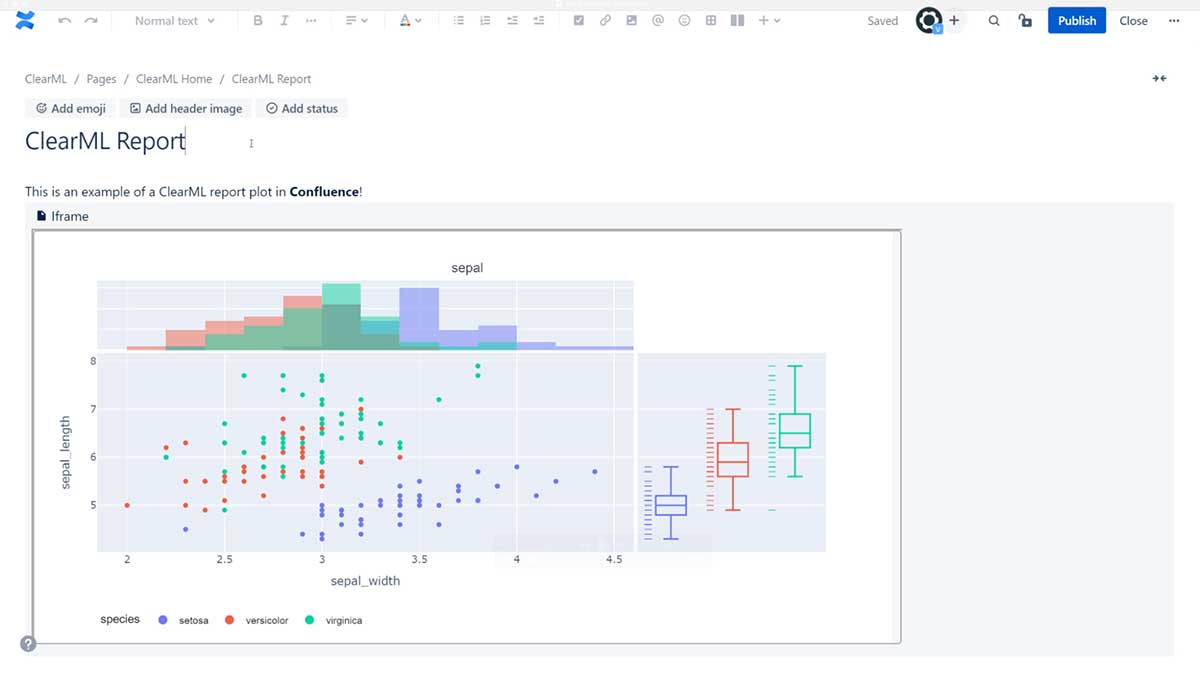
You can paste the result right into the Confluence editor. Gone are the days of screenshotting everything, now you can have fully interactive graphs that show fresh data every time you visit your document.
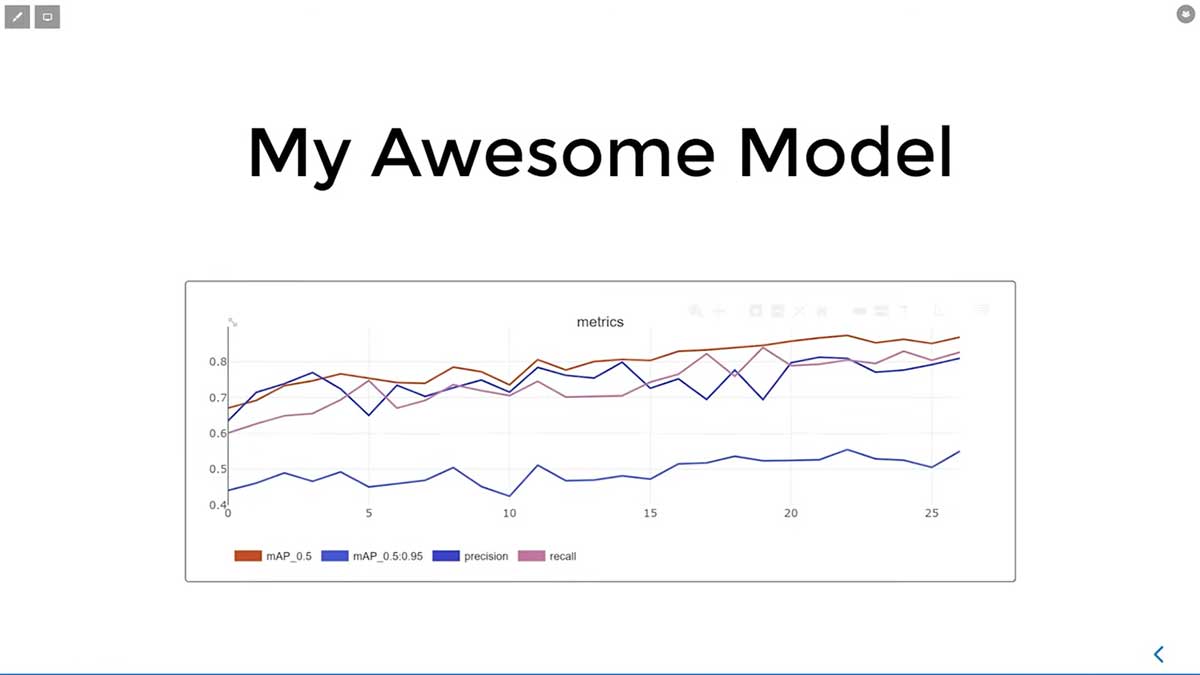
The same process applies to other reporting tools too! Plots can be embedded into Notion, Monday.com and Clickup for example. You can embed the plots inside a jupyter notebook if you want or even right into your slidedeck when using Slides.com:
The possibilities really are endless, we’re looking forward to seeing you, our community, use this functionality in all sorts of interesting ways.
Exporting
Finally, you can export your reports out of ClearML, too. On the report page in view mode, you can choose to either copy the whole thing as markdown, *or* even export the report as a PDF.
In the near future, we’ll be adding the ability to query for custom results. Imagine dashboards that can show you the performance of the best three experiments of that moment, live updating when new experiments top the charts – how cool is that?
Be sure to check out our news release announcing the general availability of ClearML Reports!
So what are you waiting for? Go check out Reports for free at app.clear.ml and hit us up on Slack, if you need any help!
Get started with ClearML by using our free tier servers or by hosting your own. Read our documentation here. You’ll find more in-depth tutorials about ClearML on our YouTube channel.
If you need to scale your ML pipelines and data abstraction or need unmatched performance and control, please request a demo.