Written by Victor Sonck, Developer Advocate at ClearML
Benchmarking the new kid on the block in a realistic production setting
Deploying models is becoming easier every day, especially thanks to excellent tutorials like Transformers-Deploy. It talks about how to convert and optimize a Hugging face model and deploy it on the Nvidia Triton inference server. Nvidia Triton is an exceptionally fast and solid tool and should be very high on the list when searching for ways to deploy a model. If you haven’t read the blogpost yet, do it now first, I will be referencing it quite a bit in this blogpost.
I’ll also be using an open-source tool called ClearML. ClearML is a suite of tools to help data scientists. You can use each tool on its own or combine them into a full “MLOps Platform.” It has an experiment manager, remote execution management, dataset version manager, model repository etc. ClearML Serving is the newest tool in there; it’s based on Triton, allows you to serve a model from the command line, and I want to see how it stacks up!
The code for setting up this example with ClearML Serving can be found here. You’ll find how to set up Triton and FastAPI as well down below. If you want more in-depth information, you can find the longer, more technical version of this blogpost on the ClearML blog here.
A Production Environment Demands For MLOps

Speed Isn’t Everything
Triton inference server is FAST. But while speed is very important and the main focus of this particular blogpost, it’s only part of the complete MLOps best practices that make your infrastructure ready for production deployments.
Triton is designed as an inference serving microservice, which means you have to spend quite a bit of time making sure it works nicely with your existing stack. This is ok, as it allows Triton to focus and excel at what it does best, but you still need quite a few extra features in a real production environment.
Model Deployment
For one, it should be connected to your model repository, so you can easily deploy new versions of your models and automate the process if required. While you’re at it, it would be nice to be able canary deploy the new model, splitting the traffic gradually from the old model to the new model. This can all be done of course, but it requires precious engineering time and deep knowledge of how Triton works.
Custom Statistics
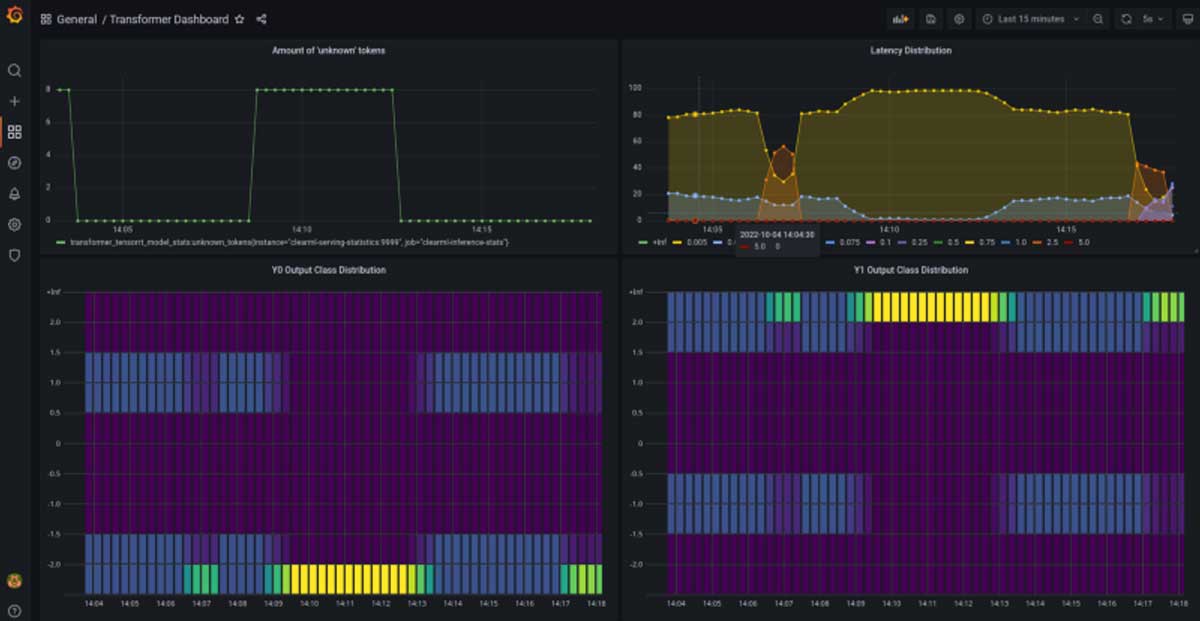
Custom statistics is another field where the out-of-the-box Triton experience is rather limited. Ideally, one could easily define custom user metrics of not only latency and throughput but also analyze the incoming and outgoing data distributions to later detect drift. It’s possible to do this in Triton, but you have to define them in C.
Traceability
Finally, a result of Triton not being integrated out of the box is limited traceability. You want to make sure that when the monitoring picks up an issue or bug, its easy to “click-through” from the deployed model, through to which pipeline was used to train it, to each of the steps of that pipeline all the way back to even which dataset version ID was used to train the model on. It’s also nice to have the logging of all your components centralized.
These are only some of the quality-of-life features ClearML Serving is trying to address. And to get a sense of just how “much” speed you’ll be giving up for these conveniences, I’m going to run a benchmark. (SPOILER: You won’t have to give up anything, you might even gain speed!)
The Benchmarking Setup
First of all, the original transformers-deploy blogpost only measured single request latency. In this blogpost, I’m going to measure latency under load as well as throughput (requests per second) as they are more indicative of production deployments. I’m also using ONNX instead of TensorRT because even in the benchmarks of the original blogpost it was faster and I couldn’t get dynamic batching working with TensorRT. Expect another blogpost when I do eventually figure it out.
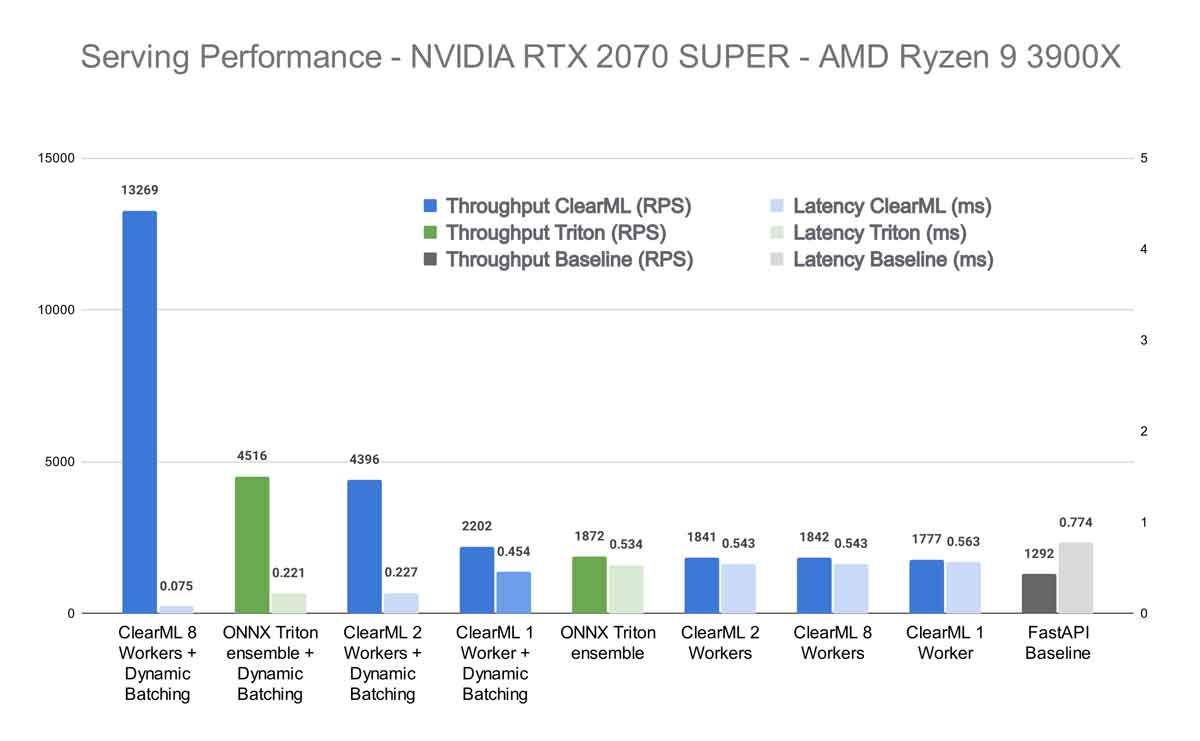
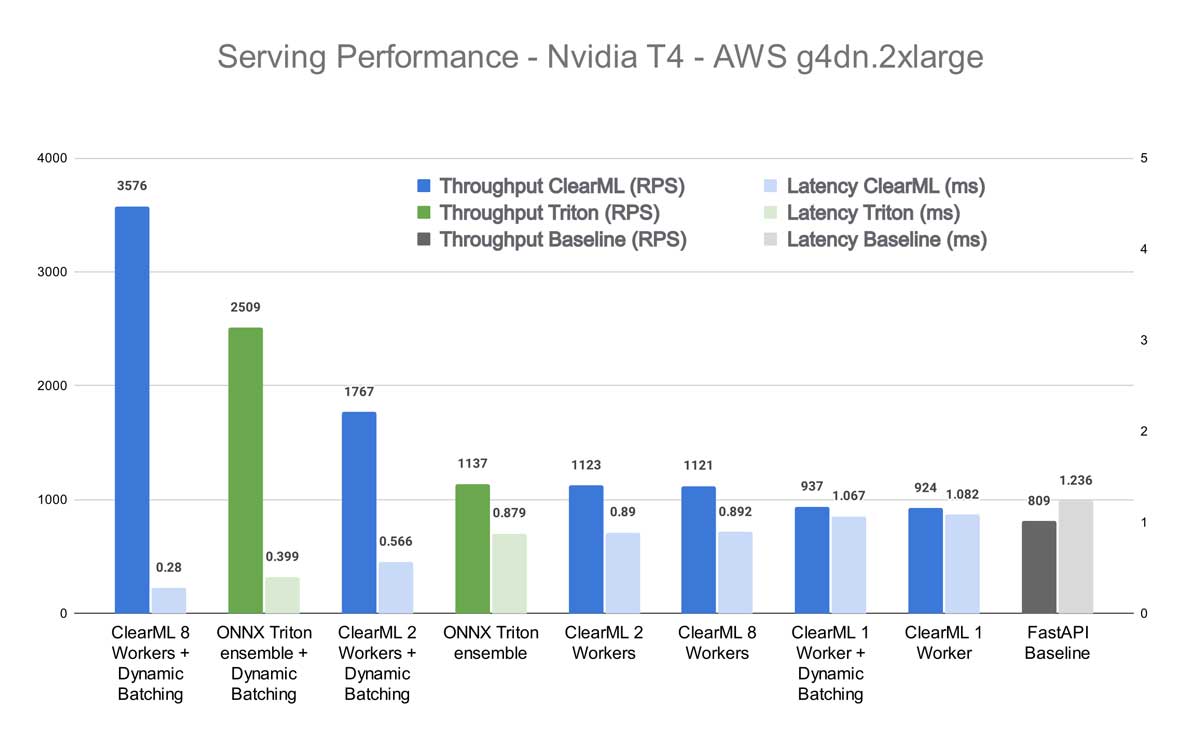
I’ve tested on 2 machines: my own PC and an AWS T4 GPU cloud instance. Details are in the graph titles. All benchmarks are run using the Apache Benchmark tool.
FastAPI Baseline
The easiest way to get a model up and running is to just “wrap it in a flask API”. The whole concept has become a bit of a joke these days because there is really no good reason why you would do this these days. Not from a performance perspective, but not even from an ease-of-use perspective!
You’ll get no seamless model updates, poor speed, no integration and you have to write everything you want yourself. Maybe it’s ok for a hobby project where you don’t need all of this and just want an API with 50 lines of python code. But even then it’s a stretch.
That said, we can use it as a baseline. This is the code for our small, impromptu model API server:
https://gist.github.com/thepycoder/a0a3d55730744a6b0dfe0db75da2e769
Triton Ensemble
Following the instructions on the accompanying GitHub repository of the original transformers deploy blogpost, we essentially have to execute only 2 docker commands.
Following these steps will also actually set up 3 different endpoints. 1 for the model itself, 1 for the tokenizer, and then a 3rd endpoint which runs these 2 one after another in an ensemble. You’ll read more about that later.
https://gist.github.com/thepycoder/21561d51b5880a7d0cdf04041433acaf
ClearML Serving
You’ll get all the quality-of-life features described above, as well as the performance of Triton. Best of both worlds!
You can deploy the open-source ClearML Serving stack on Kubernetes for production environments or use docker-compose if you want to keep it small. Check the GitHub instructions to set up your stack, but it boils down to setting an API key to the ClearML server and running docker-compose up
Once the stack is running, we can upload the pre-trained model to the ClearML server’s model repository. If you’re using the experiment manager to train your own models, they will already be in there.
https://gist.github.com/thepycoder/eaf34a947b8c62f8cb7f4a0072fc6d26
Now that we have the model registered, all we have to do is deploy it, which we can do with a single command! You can find all the input and output information in the config.pbtxt that comes with the Triton models.
https://gist.github.com/thepycoder/8816eaf939a95ea7a1713208f9c654a5
ClearML serving makes use of front-end worker threads to handle user requests as well as handle any of the preprocessing that might need to happen before the requests gets routed to the inference server. The cool thing about that is that these threads a lightweight and easy to scale separately from the inference server itself. This is what is meant when in the performance plots we say “8 workers” for example. It means there are 8 front-end threads handling requests and preprocessing loads. Scaling the preprocessing stage separately from the inference server can lead to significant gains in performance as we’ll see later on.
Optimizations Before Benchmarking
What About Tokenization?
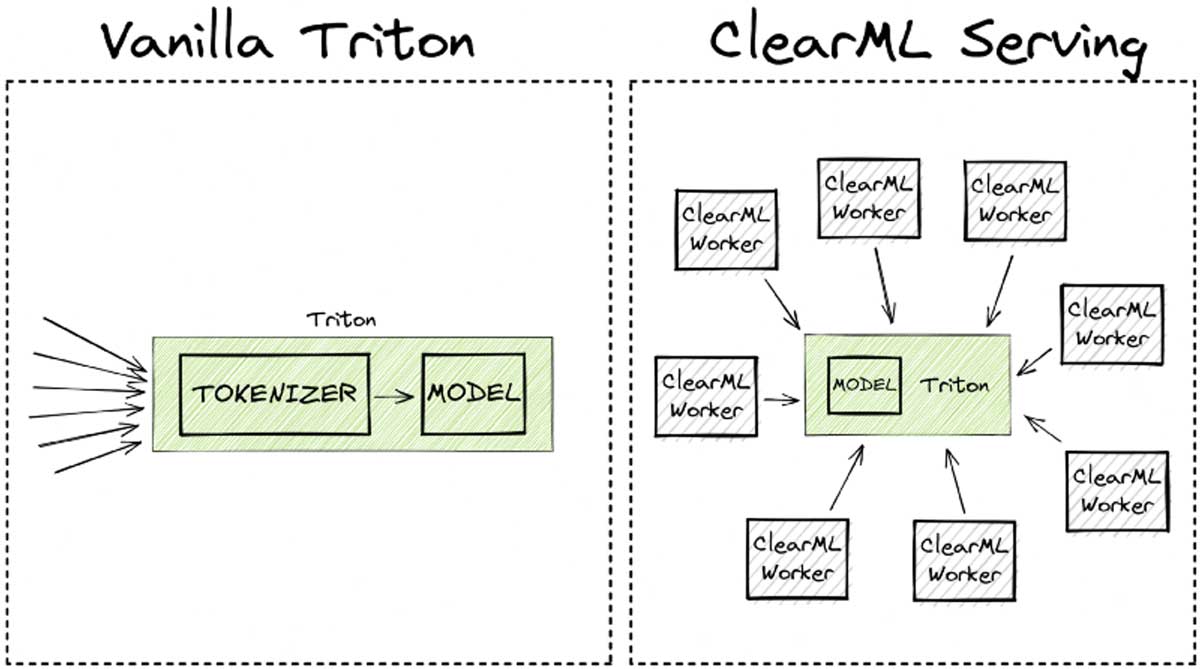
The original transformers-deploy blogpost shows you how you can set up a Triton Ensemble using a custom python model to run tokenization first, before running the model.
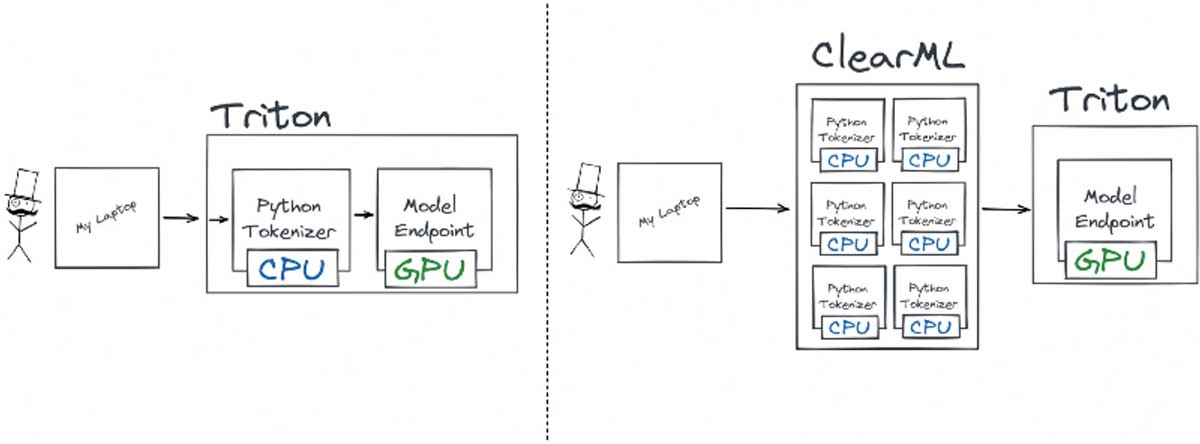
You can also see in the code snippet above that I have added a custom preprocessing.py file as the preprocessing for the ClearML Serving endpoint. This file has a very similar job as the custom python endpoint in the original blogpost: it tokenizes the request.
The main difference here is that the tokenization is done in the middle, before it reaches Triton, which makes it able to autoscale independently from the Triton server. It’s super easy to add a custom preprocessing step, as an example here is the one I used for the benchmark.
Dynamic Batching
Triton supports dynamic batching, which is a really cool and intuitive way to raise throughput at the possible cost of individual latency.
It works by holding the first incoming request for a configurable amount of time. While waiting it is listening for other incoming requests, if they come in within the waiting threshold, these additional requests are added to the first to form a batch. The batch is processed earlier if it fills to a maximum size within the time limit. Usually, a batch is way more efficient to process on a GPU, so it makes sense to try and optimize the hardware utilization in this way.
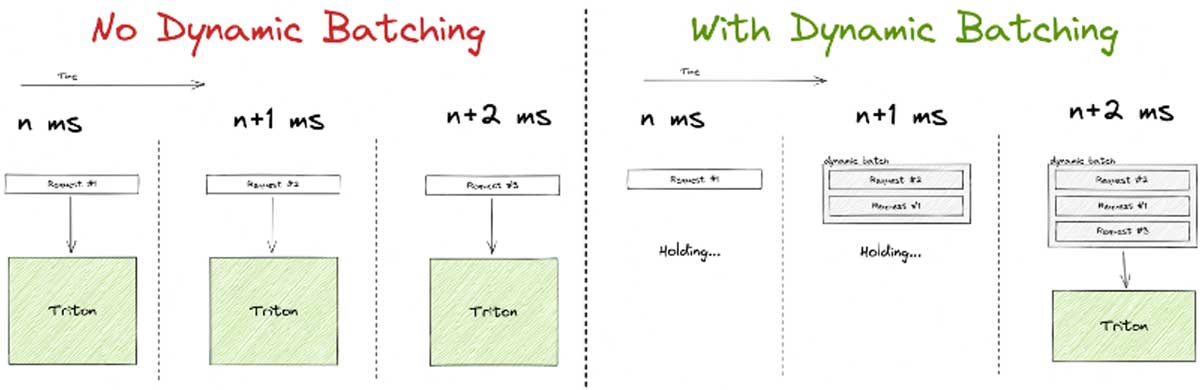
Be aware though, that dynamic batching is mainly targeted toward high-load systems, and it’s easy to see why. If your system only periodically gets a request in, a high percentage of the requests will end up waiting for additional traffic that never comes. They will be sent through the GPU all alone and end up with way more latency than the system is capable of, without any tangible benefit.
The Results!
We fire up AB and start slamming the contenders with requests, measuring latency and throughput.
First off, we want to know how our contenders perform without enabling Triton dynamic batching. As expected the FastAPI wrapper around the Hugging Face interface lags behind, although it does hold up surprisingly well against the others. As you’ll see though, this is only for batch size 1, but it’s still quite impressive for a server that essentially amounts to 21 lines of code.

Next, we see that ClearML comes second with a result that depends on how many workers are used but it never quite reaches Triton in terms of speed. And this makes sense because, in the end, it’s adding additional functionality on top of Triton itself, which will introduce extra latency. It isn’t much, but it stands to reason it can never fully match the performance of Triton in this case.
The story changes quite drastically when enabling dynamic batching on the Triton server though. Bear in mind I enabled dynamic batching both on our underlying Triton instance as well as for the one from Transformers-Deploy.
We see that when using 1 ClearML Worker, we essentially get more or less the same performance as without dynamic batching. This, too, makes sense as the 1 worker quickly ends up being the bottleneck in this scenario. But things start to change quickly when ramping up the number of workers. When using 8 ClearML workers, the total throughput is significantly higher than even the Triton Ensemble!
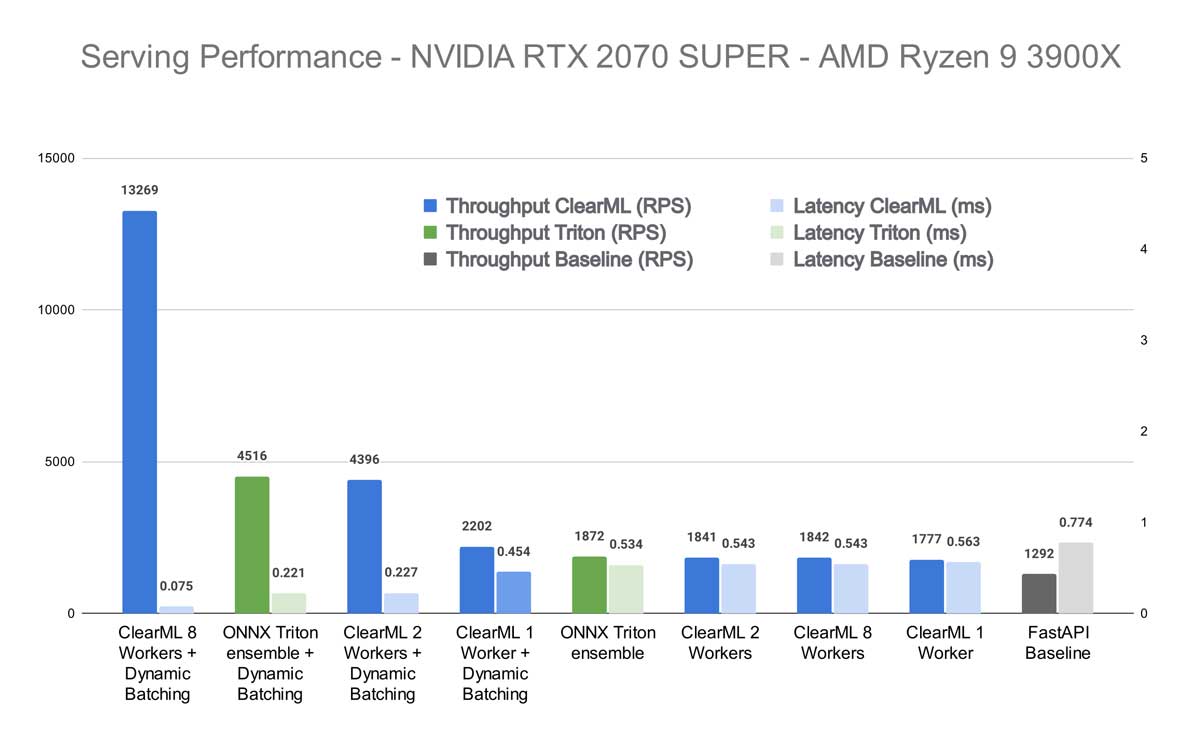
This effect is even more pronounced in my own machine. It seems that the higher quality, speed, and core count of the CPU has a drastic effect on performance in the case of ClearML Serving. Not surprising, because the ClearML workers rely heavily on CPU-based scaling to be able to properly feed the GPU. Comparing the 8-worker ClearML result with dynamic batching to the Triton ensemble with dynamic batching, you get the performance increase from the title. If you compare that to Triton out of the box, without dynamic batching, it would be a whopping 608% increase.
Wait, but I said before that we cannot hope to even match the Triton performance, let alone surpass it by this much. Well, that was true before the dynamic batching. But after enabling it, the single instance of the python “model” that is running the tokenization, is starting to become a bottleneck.
Essentially, what this means is that at a certain scale, ClearML Serving starts outscaling its overhead, essentially giving you all of its extra features for free!
Conclusion
To deploy at scale, there are quite a few things more to take into account than purely single request latency. The authors of the Transformer-Deploy blogpost and repository have done an excellent job in providing a framework in which to optimize Hugging Face models for production. In this blogpost, we took it one step further and showed just how much performance you can expect from these models in a more realistic production scenario.
We ended up adding necessary infrastructure like the ability to deploy new models automatically, add custom statistics and keep track of model versions while still achieving a 3x increase in throughput at scale.
Again, the code to recreate this example yourself can be found here
If you’re interested in checking out ClearML itself, go to our GitHub repository and give it a spin! If you need any help, feel free to join our Slack channel and our community will be glad to help you out!